readgeoraster
Read geospatial raster data file
Syntax
Description
[
creates an array by reading geographic or projected raster data from a file with a format
such as GeoTIFF, Esri Binary Grid, GRIB, or DTED. The output argument A,R] = readgeoraster(filename)R
is the raster reference for the array. For a full list of supported formats, see Supported Formats.
[
specifies options using one or more name-value arguments.A,R] = readgeoraster(___,Name=Value)
Examples
Read a GeoTIFF image of Boston [1] into the workspace as an array and a raster reference object. The array is of size 2881-by-4481-by-3 and specifies the red, green, and blue components of the image.
[A,R] = readgeoraster("boston.tif");Display the image on a map.
figure
geoimage(A,R)
geobasemap none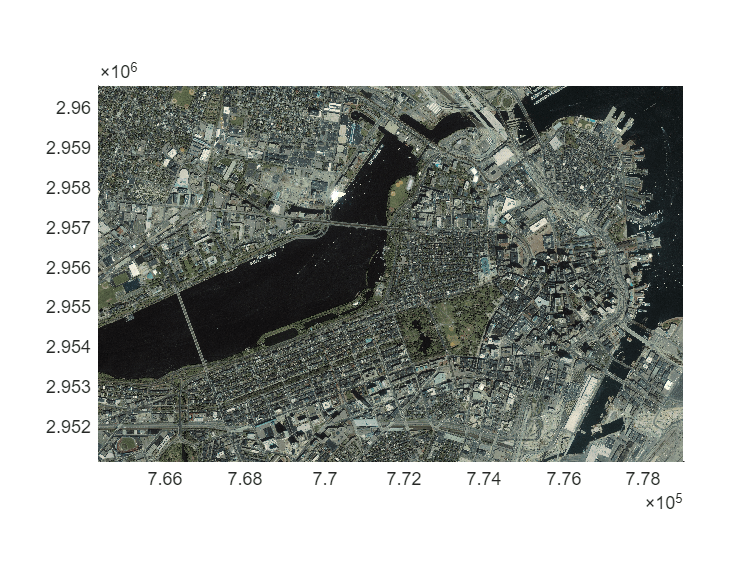
[1] The data used in this example includes material copyrighted by GeoEye, all rights reserved.
Read and display a land cover classification of Oahu, Hawaii.
Read the land cover data [1] into the workspace as an array, a map cells reference object, and a colormap. The elements of A index into the colormap. Each row of the colormap specifies the red, green, and blue components of a single color.
[A,R,cmap] = readgeoraster("oahu_landcover.img");Prepare to display the land cover data with the geoimage function by converting the array and the colormap to an RBG image.
RGB = ind2rgb(A,cmap);
Set up a map using the projected coordinate reference system (CRS) that is stored in the reference object. Display the RGB image on the map.
figure
pcrs = R.ProjectedCRS;
newmap(pcrs)
geoimage(RGB,R)

[1] The data used in this example is courtesy of the National Oceanic and Atmospheric Administration (NOAA).
Read and display elevation data for an area around South Boulder Peak in Colorado.
Read the elevation data [1] into the workspace as an array and a raster reference object.
[A,R] = readgeoraster("n39_w106_3arc_v2.dt1");Set up a map using a projected CRS that is appropriate for central Colorado. Create the CRS using the EPSG authority code 26954, which uses a Lambert Conic Conformal projection method.
figure
pcrs = projcrs(26954);
newmap(pcrs)
Display the elevation data on the map. Apply a colormap that is appropriate for elevation data. Add a color bar.
geopcolor(A,R)
demcmap(A)
colorbar

[1] The elevation data used in this example is from the US Geological Survey.
Since R2023b
GRIB files often store data using multiple bands. If you do not know which bands to read, you can query the metadata stored in the GRIB file.
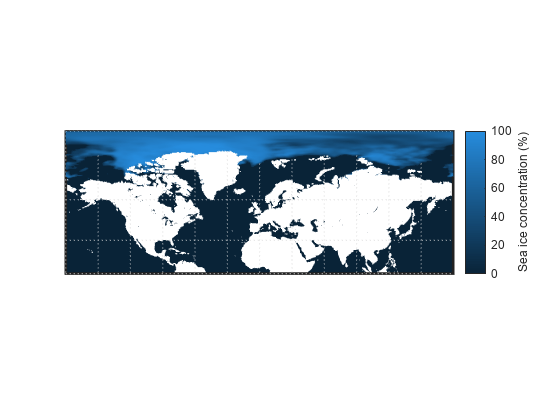
Read and display a band of data from a GRIB file. The file contains sea ice concentrations for multiple years [1][2], and each band of the file corresponds to a different year.
Get information about the GRIB file by creating a RasterInfo object. Get the metadata by accessing the Metadata property of the RasterInfo object.
info = georasterinfo("seaice.grib");
metadata = info.Metadata;
RasterInfo objects store GRIB metadata using a table, where each row of the table corresponds to a band of data in the file. Find the band that contains data for the year 2016.
yrs = year(metadata.ReferenceTime);
band = find(yrs == 2016);
Read data from the band by using the readgeoraster function. Convert the concentrations to percentages.
[A,R] = readgeoraster("seaice.grib",Bands=band);
A = A * 100;
Set up a map using a projected CRS that is appropriate for an Arctic region. Create the CRS using the EPSG authority code 5041, which uses a Polar Stereographic projection method.
figure
pcrs = projcrs(5041);
newmap(pcrs)
Display the data on a map. Change the colormap, add a title, and add a color bar.
geopcolor(A,R)

colormap abyss
title("Sea Ice Concentration (%)")
colorbar
[1] Hersbach, H., B. Bell, P. Berrisford, G. Biavati, A. Horányi, J. Muñoz Sabater, J. Nicolas, et al. "ERA5 Hourly Data on Single Levels from 1940 to Present." Copernicus Climate Change Service (C3S) Climate Data Store (CDS), 2023. Accessed May 22, 2023. https://doi.org/10.24381/cds.adbb2d47.
[2] Neither the European Commission nor ECMWF is responsible for any use that may be made of the Copernicus information or data it contains.
Input Arguments
Name-Value Arguments
Output Arguments
More About
Tips
Some functions require input arguments of type
singleordouble, such as thegeoshowfunction for displaying surfaces. To use the output ofreadgeorasterwith these functions, specify the output type as"single"or"double"using theOutputTypename-value argument.Regardless of the file format, the array returned by
readgeorasterhas columns starting from north and theColumnsStartFromproperty of the reference object has a value of"north".