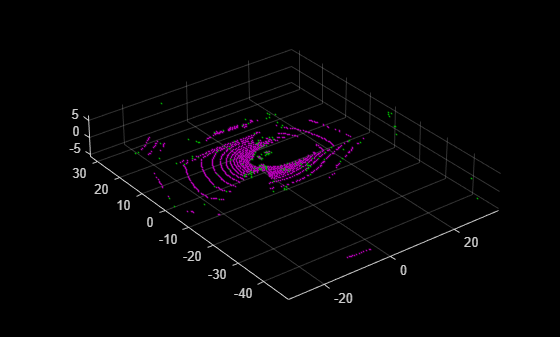
Main Content

show

Visualize LOAM map

Since R2022b

    Description

    example

    show(loamMap) displays the edge and surface points contained in the input lidar odometry and mapping (LOAM) map. The function displays surface points in magenta and edge points in green.

    show(loamMap,Name=Value) specifies options using one or more name-value argument. For example, MarkerSize=5 sets the diameter size of the marker to 5 points.

    ax = show(___) returns the plot axes using any combination of input arguments from previous syntaxes.

    Examples

    collapse all

    Create a LOAM map to store LOAM feature points.

    voxelSize = 0.5;
    loamMap = pcmaploam(voxelSize);

    Load point cloud data into the workspace.

    ld = load("drivingLidarPoints.mat");

    Detect LOAM feature points.

    points = detectLOAMFeatures(ld.ptCloud);

    Add the LOAM points to the map.

    absPose = rigidtform3d;
    addPoints(loamMap,points,absPose)

    Visualize the points in the LOAM map.

    show(loamMap)

    Input Arguments

    collapse all

    LOAM map, specified as a pcmaploam object.

    Name-Value Arguments

    Specify optional pairs of arguments as Name1=Value1,...,NameN=ValueN, where Name is the argument name and Value is the corresponding value. Name-value arguments must appear after other arguments, but the order of the pairs does not matter.

    Example: show(loamMap,MarkerSize=5) sets the diameter size of the marker to 5 points.

    Diameter of each marker, specified as a positive scalar. The value specifies the approximate diameter of the markers used for each LOAM point in the display. MATLAB® graphics defines the unit as points.

    Axes on which to display the visualization, specified as an Axes object. To create an Axes object, use the axes function. To display the visualization in a new figure, leave Parent unspecified.

    Output Arguments

    collapse all

    Plot axes, returned as an axes graphics object. You can set the default center of rotation for the viewer as around the axes center or a point. Set the default behavior from the Computer Vision Toolbox Preferences.

    Version History

    Introduced in R2022b

    See Also

    Objects

    Functions