Analyze Fuzzy System Using Fuzzy Logic Designer
Once you define the membership functions and rule base of your fuzzy inference system (FIS), whether by manual construction or tuning, you can analyze your design using the following methods.
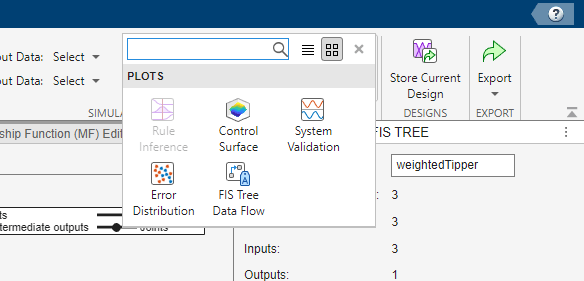
Control Surface — Plot the output values for all combinations of two input variables.
Rule Inference — Specify input values and view the inference diagram and resulting output value.
System Validation — Compare FIS output values to corresponding reference validation data. (since R2023a)
Error Distribution — View the distribution of FIS output errors for different input combinations based on reference validation data. (since R2023a)
FIS Tree Data Flow — View the propagation of inference results through a FIS tree for specified input values. (since R2024a)
To open access these methods, on the Design tab, select the corresponding icon in the Simulation gallery.
You can export your analysis results to the MATLAB® workspace for further analysis. For more information, see Export Simulation Data.
When analyzing your FIS, you can configure the resolution of the output variable universe of discourse. To do so, set the Number of Samples parameter. This parameter is not supported for Sugeno systems.
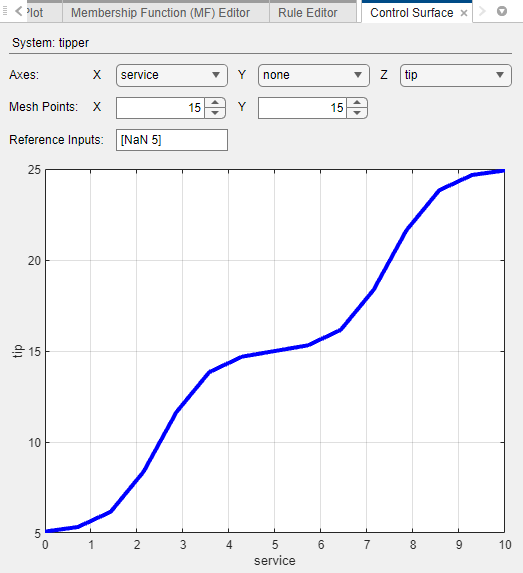
Control Surface
The Control Surface document shows the output values from the active FIS design for all possible combinations of two input variables.

In the Axes section, select the input variables for the
X and Y axes, and an output variable for the
Z, axis. The preceding figure shows the variable selections when
analyzing a single FIS, the lists contain the names of the selected variables. When you
analyze a FIS tree, the list entries specify the name of the component FIS along with the
variable name, for example, fis1/input1.
In the Mesh Points section, you can specify the plot resolution along the X and Y axes. For a smoother plot, specify a larger number of points mesh points.
If your system has more than two inputs, you must specify a reference value for each input variable not shown in the plot. To do so, specify the Reference Inputs parameter. For example, the following figure shows a reference input for a three-input system for which the first and second variables are used in the control surface plot.
![Control Surface document settings showing the Reference Inputs parameter for a three-input system. The first two inputs are selected for the X and Y axes of the plot. The reference values are [NaN NaN 0.5].](app-control-surface-reference.png)
For each variable that is used in the control surface plot, specify a reference value of
NaN.
You can also view a control surface for a single input variable. In this case, in the
Axes section, in the X list, select the input
variable and, in the Y list, select none.
Then, specify the reference values for all unused input variables using the
Reference Inputs parameter.
For example, the following figure shows a control surface for a two-input system where the output is plotted against the first input variable.
Rule Inference
In the Rule Inference document, you specify values for your input variables, inspect the inference process, and view the resulting output value produced by the active FIS design. The Rule Inference document does not support FIS trees.
For more information on the fuzzy inference process for different FIS types:
For type-1 Mamdani systems, see Fuzzy Inference Process.
For type-1 Sugeno systems, see Mamdani and Sugeno Fuzzy Inference Systems.
For type-2 systems, see Type-2 Fuzzy Inference Systems.
To select input values, in the Rule Inference document, specify the Input values parameter. Alternatively, you can drag the input bars.

The preceding figure shows the Rule Inference document for a type-1 Mamdani system.
The fuzzified inputs activate the second and third rules. The firing strengths of these rules are applied to the output variable. When the resulting output membership functions are aggregated and defuzzified, the final output value is 21.7.
The following figure shows the same inference process for a type-2 Mamdani system. In this case, the fuzzified inputs generate firing strengths for both the upper and lower membership functions.

System Validation
Since R2023a
To validate your FIS designs, you can compare output values to corresponding reference validation data.
The System Validation document shows simulation results for all designs that you select in the Design Browser. To select a FIS design, select the corresponding entry in the Compare column.

To perform system validation for your FIS, you must first specify reference input and output data. For more information, see Specify Validation Data.
Using the System Validation document, you can view plots of:
Reference input values. Select the inputs to plot in the Reference Inputs table.
FIS output values and the corresponding reference output values. Select the outputs to plot in the Outputs table.
Output prediction errors, which are the differences between the output and reference output values. To view the prediction errors, select the Prediction errors parameter. You can view the root mean squared error (RMSE) for each output in the legend of the prediction error plot.
To view corresponding numerical values from across all the plots, point to any of the plot lines.

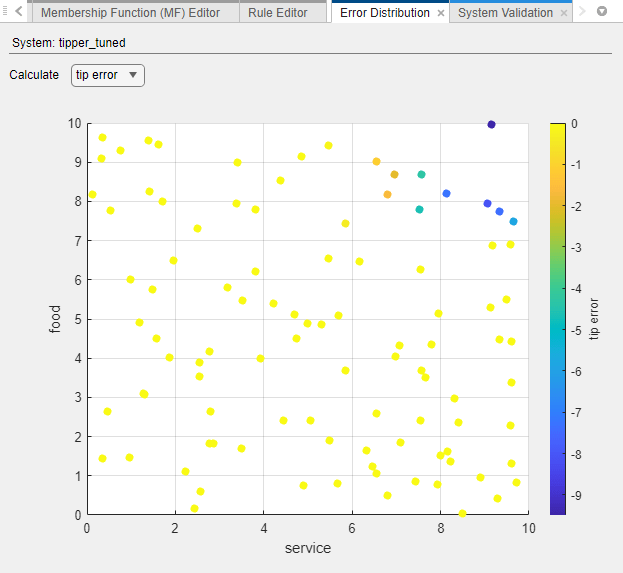
Error Distribution
Since R2023a
The Error Distribution document is a graphical representation of the output error for the active FIS design as compared to reference output data.
For a multi-output FIS, in the Calculate list, select the output
for which you want to analyze the error distribution. When you analyze a FIS tree, the
outputs listed in this list display the name of the component FIS along with the variable
name, for example, fis1/input1.
To analyze the error distribution for your FIS, you must first specify reference input and output data. For more information, see Specify Validation Data.
Using the Error Distribution document, you can:
Find input regions for which your FIS produces a less-accurate model of the data, which results in larger output errors.
Find input regions where you have fewer data points
For example, the following figure shows the error distribution for a tipping system with two inputs, service quality and food quality. The FIS performs well for most of the input space. However, there are significant errors in the upper-right region of the plot, which corresponds to situations where both the service and food have a high quality rating. In this case:
If you manually created the FIS, you should add or update rules for this input condition.
If you tuned the FIS from data, you might need more training data that covers this input region.
FIS Tree Data Flow
Since R2024a
To analyze the behavior of FIS tree design, you can view the propagation of inference results through the FIS tree for specified input values.
When you select FIS Tree Data Flow in the Simulation gallery, the FIS Tree Plot document displays input and output values for each FIS in the FIS tree.
To specify FIS input values, use the Input values field.
For example, the following figure shows the FIS tree data flow for the
weightedTipper system from Build FIS Tree Using Fuzzy Logic Designer.
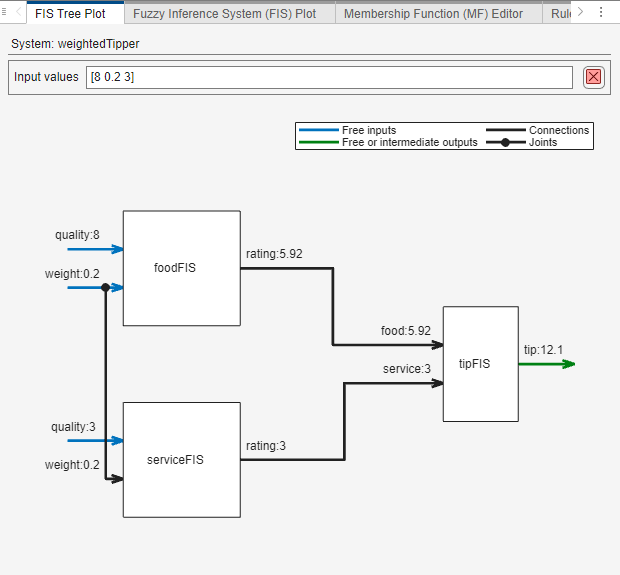
By examining the data flow, you can assess the behavior of each FIS in the tree and the resulting overall behavior. For example, if the overall FIS behavior does not match your expectations, you can identify potentially problematic intermediate FIS outputs. You can then further analyze and modify the behavior of the corresponding FIS.
Specify Validation Data
The System Validation and Error Distribution analysis documents require reference validation data.
To select validation data, on the Design tab:
In the Input Data list, select the reference input data.
In the Output Data list, select the reference output data.

For both input and output data, you can select previously imported data, such as training data from tuning, or data from the MATLAB workspace.
The Input Data and Output Data lists show only data that is compatible with the input and output configurations of your FIS.
The input validation data must be a numerical array where the number of columns is equal to the number of input variables in your FIS.
The output validation data must be a numerical array where the number of columns is equal to the number of output variables in your FIS.
The input data and output data arrays must have the same number of rows.