Code Coverage for Models in Software-in-the-Loop (SIL) Mode and Processor-in-the-Loop (PIL) Mode
If you have Embedded Coder® and Simulink® Coverage™, you can analyze coverage for generated code during a software-in-the-loop (SIL) or processor-in-the-loop (PIL) simulation.
Enable SIL or PIL Code Coverage for a Model
To record SIL or PIL code coverage for a model:
Ensure you have a supported compiler installed. For a list of supported compilers, refer to the compilers supported by Embedded Coder at Supported and Compatible Compilers.
In the Configuration Parameters dialog box, on the left pane, click Code Generation. From the list, select Verification.
Under Code profiling, set Measure function execution times to
Off.Under Code coverage for SIL or PIL, set Third-party tool to
None (use Simulink Coverage).Enable coverage for a model in SIL or PIL mode or a reference model in SIL or PIL mode. For more information about enabling coverage, see Model Coverage (Simulink Coverage).
Run a SIL or PIL simulation.
Note
The Coverage (Run) button in the Coverage toolstrip forces a normal mode simulation for the top-level model and does not yield SIL or PIL code coverage.
To run a SIL or PIL simulation:
In the Simulink window, click Apps and then click SIL/PIL Manager.
In the SIL/PIL tab, click Automated Verification > SIL/PIL Simulation Only.
Click Run SIL/PIL.
Review the Coverage Results for Models in SIL or PIL Mode
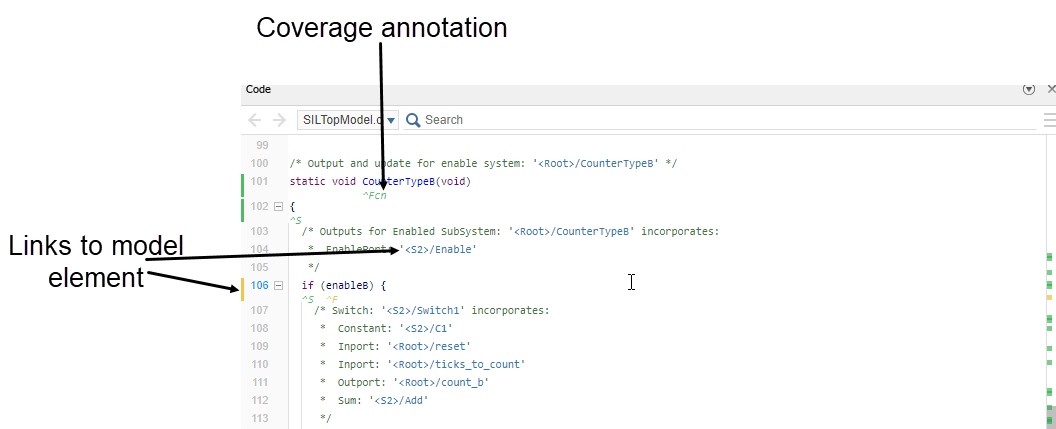
To view the code coverage information in the Code pane, click the menu icon to the right of the search box and select Show code coverage. If the option is disabled, then on the Coverage tab, click Coverage Highlighting. The code displays highlighting and annotations that show code coverage information. You can navigate from the code to the associated model blocks by using the links in the line numbers, code elements, and comments.
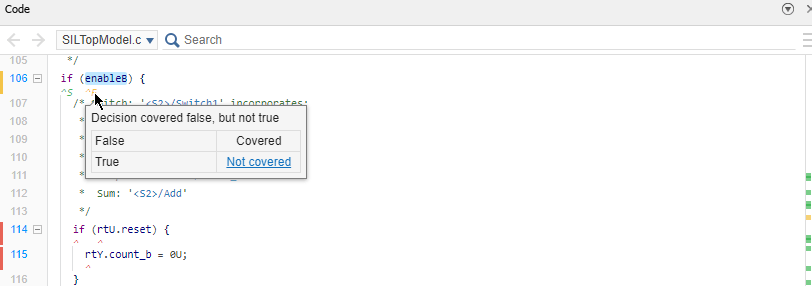
If you point your cursor at a coverage annotation, a tooltip with additional information appears.
In R2023a: If coverage is missing, you can click the Not covered link in the tooltip to open the Filter Explorer pane of the Coverage Results Explorer with a new justification rule for the outcome you selected.
At the bottom of the Code view, Simulink Coverage shows a summary of the code coverage report. Point your cursor at one of the listed metrics to view a tooltip with additional information.

Limitations
Coverage for models in SIL and PIL mode has these limitations:
The model must meet the requirements listed in Enable SIL or PIL Code Coverage for a Model.
Code coverage results must not include external C/C++ files in read-only folders.
The Coverage (Run) button in the Coverage toolstrip forces a Normal simulation and will not yield SIL or PIL code coverage.
Code coverage cannot be analyzed for processor-in-the-loop mode on Mac machines.
The Code pane does not support annotations or tooltips for Modified Condition Decision Coverage (MCDC) outcomes. As a result, you cannot justify these outcomes from the Code pane.
The Code pane does not support creating exclusion filter rules. To create exclusion filter rules, use the coverage report.
See Also
Topics
- Custom Toolchain Directives Required for Code Coverage and Execution Profiling
- Software-in-the-Loop Code Coverage (Simulink Coverage)
- SIL/PIL Manager Verification Workflow
- View and Filter Code Coverage Results Using the Code Pane (Simulink Coverage)
- Evaluate Differences Between Model and Code Coverage (Simulink Coverage)