Visualization and Verification
Visualize deep networks during and after training. Monitor training progress using built-in plots of network accuracy and loss. To investigate trained networks, you can use visualization techniques such as Grad-CAM.
Use deep learning verification methods to assess the properties of deep neural networks. For example, you can verify the robustness properties of a network, compute network output bounds, and find adversarial examples.
Apps
| Deep Network Designer | Design and visualize deep learning networks |
Functions
Properties
| ConfusionMatrixChart Properties | Confusion matrix chart appearance and behavior |
| ROCCurve Properties | Receiver operating characteristic (ROC) curve appearance and behavior (Since R2022b) |
Topics
Interpretability
- Visualize Activations of LSTM Network
This example shows how to investigate and visualize the features learned by LSTM networks by extracting the activations. - Interpret Deep Learning Time-Series Classifications Using Grad-CAM
This example shows how to use the gradient-weighted class activation mapping (Grad-CAM) technique to understand the classification decisions of a 1-D convolutional neural network trained on time-series data. - View Network Behavior Using tsne
This example shows how to use thetsnefunction to view activations in a trained network. - Deep Learning in MATLAB
Discover deep learning capabilities in MATLAB® using convolutional neural networks for classification and regression, including pretrained networks and transfer learning, and training on GPUs, CPUs, clusters, and clouds. - Deep Learning Tips and Tricks
Learn how to improve the accuracy of deep learning networks.
Training Progress and Performance
- Monitor Deep Learning Training Progress
This example shows how to monitor the training progress of deep learning networks. - Monitor Custom Training Loop Progress
Track and plot custom training loop progress. - ROC Curve and Performance Metrics
Userocmetricsto examine the performance of a classification algorithm on a test data set.
Featured Examples
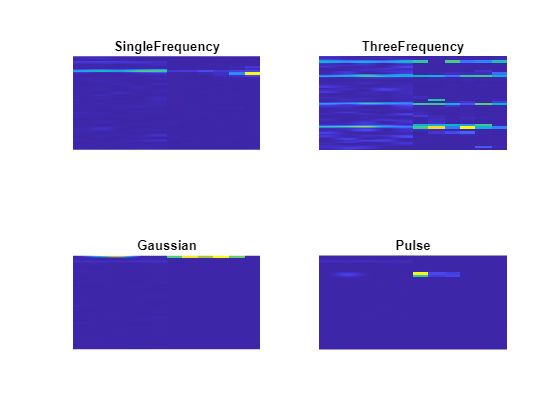
Investigate Spectrogram Classifications Using LIME
Use locally interpretable model-agnostic explanations (LIME) to investigate the robustness of a deep convolutional neural network trained to classify spectrograms. LIME is a technique for visualizing which parts of an observation contribute to the classification decision of a network. This example uses the imageLIME function to understand which features in the spectrogram data are most important for classification.

Investigate Audio Classifications Using Deep Learning Interpretability Techniques
Use interpretability techniques to investigate the predictions of a deep neural network trained to classify audio data.

Time Series Forecasting Using Deep Learning
Forecast time series data using a long short-term memory (LSTM) network.

Train Speech Command Recognition Model Using Deep Learning
Train a deep learning model that detects the presence of speech commands in audio. The example uses the Speech Commands Dataset [1] to train a convolutional neural network to recognize a set of commands.

Chemical Process Fault Detection Using Deep Learning
Use simulation data to train a neural network than can detect faults in a chemical process.
Select a Web Site
Choose a web site to get translated content where available and see local events and offers. Based on your location, we recommend that you select: United States.
You can also select a web site from the following list
Americas
- América Latina (Español)
- Canada (English)
- United States (English)
Europe
- Belgium (English)
- Denmark (English)
- Deutschland (Deutsch)
- España (Español)
- Finland (English)
- France (Français)
- Ireland (English)
- Italia (Italiano)
- Luxembourg (English)
- Netherlands (English)
- Norway (English)
- Österreich (Deutsch)
- Portugal (English)
- Sweden (English)
- Switzerland
- United Kingdom (English)
Asia Pacific
- Australia (English)
- India (English)
- New Zealand (English)
- 中国
- 日本Japanese (日本語)
- 한국Korean (한국어)