plotsomplanes
(To be removed) Plot self-organizing map weight planes
plotsomplanes will be removed in a future release. For more information,
see Transition Legacy Neural Network Code to dlnetwork Workflows.
For advice on updating your code, see Version History.
Syntax
plotsomplanes(net)
Description
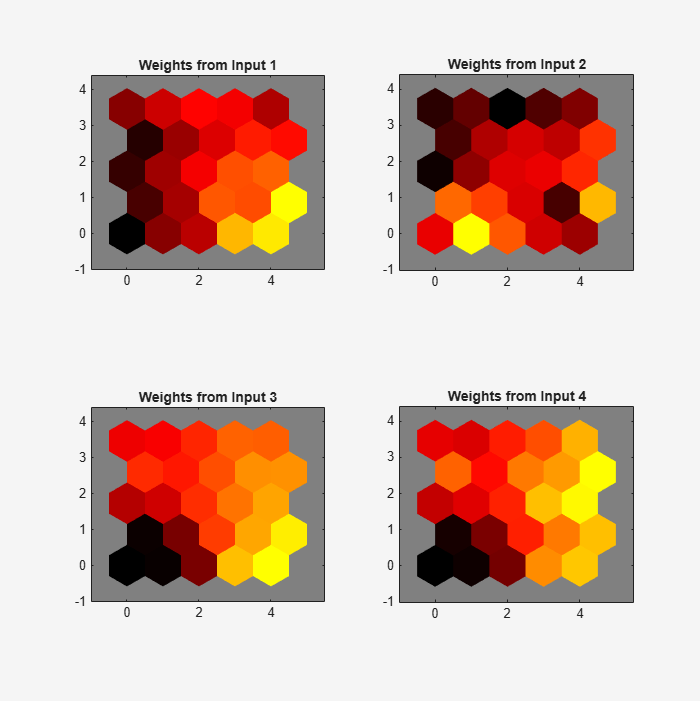
plotsomplanes(net) generates a set of subplots. Each
ith subplot shows the weights from the ith
input to the layer’s neurons, with the most negative connections shown as black, zero
connections as red, and the strongest positive connections as yellow.
The plot is only shown for layers organized in one or two dimensions.
This plot supports SOM networks with hextop and
gridtop topologies, but not tritop or
randtop.
This function can also be called with standardized plotting function arguments used by
the function train.
Examples
Plot SOM Weight Planes
x = iris_dataset;
net = selforgmap([5 5]);
net = train(net,x);
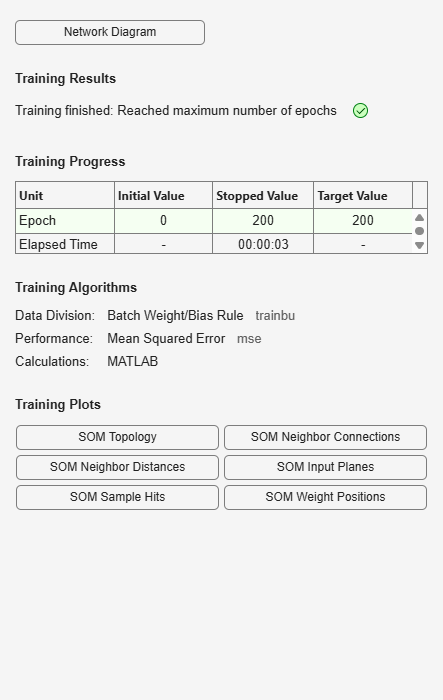
plotsomplanes(net)
Version History
Introduced in R2008aSee Also
Time Series
Modeler | fitrnet (Statistics and Machine Learning Toolbox) | fitcnet (Statistics and Machine Learning Toolbox) | trainnet | trainingOptions | dlnetwork