Acquire Data Using NI FieldDAQ Device
R2026bThis example shows how to acquire data from an NI™ FieldDAQ device.
Discover Analog Input Devices
To discover a device that supports input measurements, access the device in the table returned by the daqlist command. This example uses an NI FD-11603 device. This device has two banks, each with 4 channels. Channel 0 of Bank 1 is connected to a frequency generator that produces a 1 kHz sine wave (1 Vpp centered around 0.5V).
d = daqlist("ni")d = 10×4 table
"Dev1" "National Instruments(TM) USB-6351" "USB-6351" 1×1 DeviceInfo
"FD11603-1D3BB09-Bank1" "National Instruments(TM) FD-11603" "FD-11603" 1×1 DeviceInfo
"FD11603-1D3BB09-Bank2" "National Instruments(TM) FD-11603" "FD-11603" 1×1 DeviceInfo
"FieldDAQ1-Bank1" "National Instruments(TM) FD-11603" "FD-11603" 1×1 DeviceInfo
"FieldDAQ1-Bank2" "National Instruments(TM) FD-11603" "FD-11603" 1×1 DeviceInfo
"FieldDAQ2-Bank1" "National Instruments(TM) FD-11613" "FD-11613" 1×1 DeviceInfo
"FieldDAQ3-Bank1" "National Instruments(TM) FD-11634" "FD-11634" 1×1 DeviceInfo
"FieldDAQ3-Bank2" "National Instruments(TM) FD-11634" "FD-11634" 1×1 DeviceInfo
"FieldDAQ4-Bank1" "National Instruments(TM) FD-11637" "FD-11637" 1×1 DeviceInfo
"FieldDAQ4-Bank2" "National Instruments(TM) FD-11637" "FD-11637" 1×1 DeviceInfo
Create DataAcquisition Interface and Add Analog Input Channels
Create a DataAcquisition, set the Rate property (the default is 1000 scans per second), and add analog input channels using addinput.
dq = daq("ni");
dq.Rate = 20000;
addinput(dq,"FD11603-1D3BB09-Bank1","ai0","Voltage");
Warning: Added channel does not support on-demand operations: only clocked operations are allowed.
Acquire Data for Specified Duration
Use read to acquire multiple scans, blocking MATLAB® execution until the acquisition completes. The acquired data is returned as a timetable with width equal to the number of channels and height equal to the number of scans.
% Acquire data for one second at 20000 scans per second.
data = read(dq, seconds(1));
Plot Acquired Data
t = data.Time;
v = data.Variables;
n = 200;
plot(t(1:n), v(1:n));
ylabel("Voltage (V)")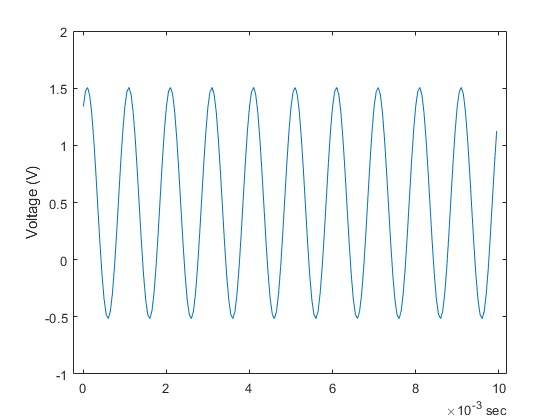
Acquire Specified Number of Scans
data = read(dq, 200);
plot(data.Time, data.Variables);
ylabel("Voltage (V)")