pammod
Pulse amplitude modulation (PAM)
Description
Examples
Generate random data symbols and apply pulse amplitude modulation.
Set the modulation order.
M = 8;
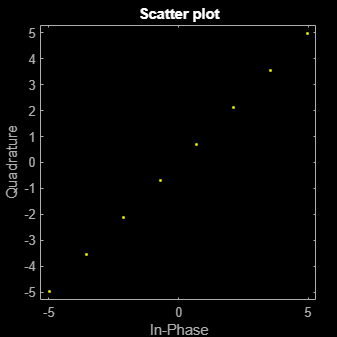
Generate random integers and apply PAM modulation having an initial phase of /4.
data = randi([0 M-1],100,1);
modData = pammod(data,M,pi/4);
Display the PAM constellation diagram.
scatterplot(modData)
Plot PAM symbol mapping for Gray-coded and binary-coded data.
Set the modulation order, and then create a data sequence containing a complete set of constellation points.
M = 8;
data = 0:M-1;
Modulate and demodulate Gray and natural binary encoded data.
symgray = pammod(data,M,0,'gray');
mapgray = pamdemod(symgray,M,0,'gray');

symbin = pammod(data,M,0,'bin');
mapbin = pamdemod(symbin,M,0,'bin');
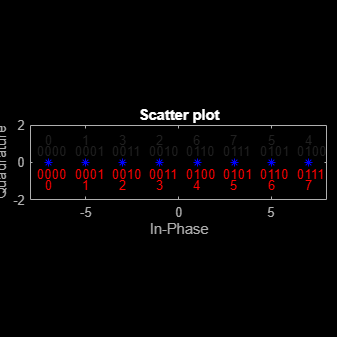
Plot the constellation points using one of the symbol sets. For each constellation point, assign a label indicating the Gray-coded and binary-coded values for each symbol.
For Gray-code symbol mapping, adjacent constellation points differ by a single bit and are not numerically sequential.
For binary-coded mapping, adjacent constellation points follow the binary encoding and are sequential.
scatterplot(symgray,1,0,'b*');
for k = 1:M
    text(real(symgray(k))-0.6,imag(symgray(k))+0.6,...
        dec2base(mapgray(k),2,4));
    text(real(symgray(k))-0.2,imag(symgray(k))+1.2,...
        num2str(mapgray(k)));

    text(real(symbin(k))-0.6,imag(symbin(k))-0.6,...
        dec2base(mapbin(k),2,4),'Color',[1 0 0]);
    text(real(symbin(k))-0.2,imag(symbin(k))-1.2,...
        num2str(mapbin(k)),'Color',[1 0 0]);
end
axis([-M M -2 2])
Input Arguments
Output Arguments
Extended Capabilities
Version History
Introduced before R2006a