pitch
Estimate fundamental frequency of audio signal
Description
f0 = pitch(audioIn,fs,Name=Value)
pitch(___) with no output arguments plots the
estimated pitch against time.
Examples
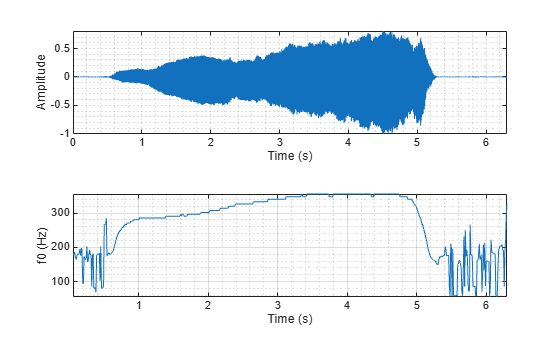
Read in an audio signal. Call pitch to estimate the fundamental frequency over time.
[audioIn,fs] = audioread("Hey-16-mono-6secs.ogg");

f0 = pitch(audioIn,fs);
Listen to the audio signal and plot the signal and pitch. The pitch function estimates the fundamental frequency over time, but the estimate is only valid for regions that are harmonic.
sound(audioIn,fs)

tiledlayout(2,1)

nexttile
t = (0:length(audioIn)-1)/fs;
plot(t,audioIn)
xlabel("Time (s)")
ylabel("Amplitude")
grid minor
axis tight

nexttile
pitch(audioIn,fs)
Read in an audio signal and extract the pitch.
[x,fs] = audioread("SingingAMajor-16-mono-18secs.ogg");
t = (0:size(x,1)-1)/fs;

winLength = round(0.05*fs);
overlapLength = round(0.045*fs);
[f0,idx] = pitch(x,fs,Method="SRH",WindowLength=winLength,OverlapLength=overlapLength);
tf0 = idx/fs;
Listen to the audio and plot the audio and pitch estimations.
sound(x,fs)

figure
tiledlayout(2,1)

nexttile
plot(t,x)
ylabel("Amplitude")
title("Audio Signal")
axis tight

nexttile
pitch(x,fs,Method="SRH",WindowLength=winLength,OverlapLength=overlapLength)
title("Pitch Estimations")

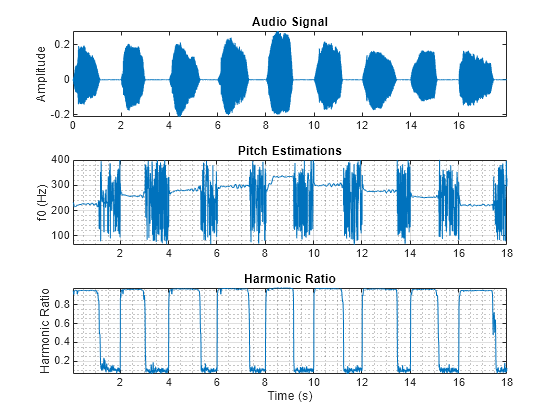
The pitch function estimates the pitch for overlapped analysis windows. The pitch estimates are only valid if the analysis window has a harmonic component. Call the harmonicRatio function using the same window and overlap length used for pitch detection. Plot the audio, pitch, and harmonic ratio.
hr = harmonicRatio(x,fs,Window=hamming(winLength,"periodic"),OverlapLength=overlapLength);

figure
tiledlayout(3,1)

nexttile
plot(t,x)
ylabel("Amplitude")
title("Audio Signal")
axis tight

nexttile
pitch(x,fs,Method="SRH",WindowLength=winLength,OverlapLength=overlapLength)
title("Pitch Estimations")
xlabel("")

nexttile
harmonicRatio(x,fs,Window=hamming(winLength,"periodic"),OverlapLength=overlapLength)
title("Harmonic Ratio")
Use the harmonic ratio as the threshold for valid pitch decisions. If the harmonic ratio is less than the threshold, set the pitch decision to NaN. Plot the results.
threshold = 0.9;
f0(hr < threshold) = nan;

figure
plot(tf0,f0)
xlabel("Time (s)")
ylabel("Pitch (Hz)")
title("Pitch Estimations")
grid on

Read in an audio signal of a female voice saying "volume up" five times. Listen to the audio.
[femaleVoice,fs] = audioread("FemaleVolumeUp-16-mono-11secs.ogg");
sound(femaleVoice,fs)
Read in an audio signal of a male voice saying "volume up" five times. Listen to the audio.
maleVoice = audioread("MaleVolumeUp-16-mono-6secs.ogg");
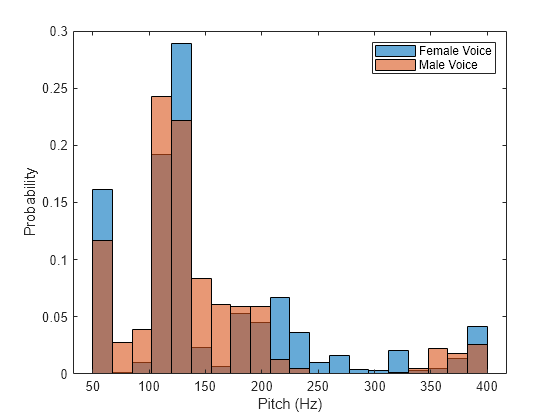
sound(maleVoice,fs)Extract the pitch from both the female and male recordings. Plot histograms of the pitch estimations for the male and female audio recordings. The histograms have a similar shape. This is because the pitch decisions contain results for unvoiced speech and regions of silence.
f0Female = pitch(femaleVoice,fs);
f0Male = pitch(maleVoice,fs);

figure
numBins = 20;
histogram(f0Female,numBins,Normalization="probability");
hold on
histogram(f0Male,numBins,Normalization="probability");
legend("Female Voice","Male Voice")
xlabel("Pitch (Hz)")
ylabel("Probability")
hold off
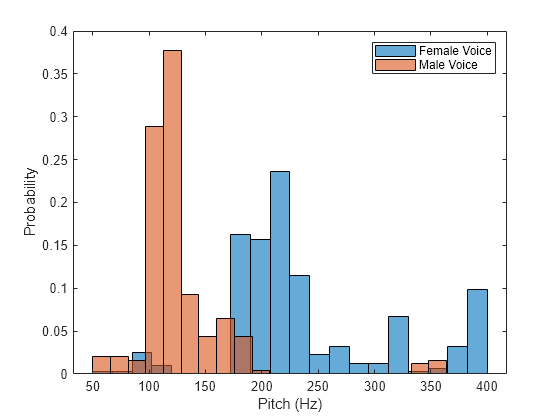
Use the detectSpeech function to isolate regions of speech in the audio signal and then extract pitch from only those speech regions.
speechIndices = detectSpeech(femaleVoice,fs);
f0Female = [];
for ii = 1:size(speechIndices,1)
    speechSegment = femaleVoice(speechIndices(ii,1):speechIndices(ii,2));
    f0Female = [f0Female;pitch(speechSegment,fs)];
end

speechIndices = detectSpeech(maleVoice,fs);
f0Male = [];
for ii = 1:size(speechIndices,1)
    speechSegment = maleVoice(speechIndices(ii,1):speechIndices(ii,2));
    f0Male = [f0Male;pitch(speechSegment,fs)];
end
Plot histograms of the pitch estimations for the male and female audio recordings. The pitch distributions now appear as expected.
figure
histogram(f0Female,numBins,Normalization="probability");
hold on
histogram(f0Male,numBins,Normalization="probability");
legend("Female Voice","Male Voice")
xlabel("Pitch (Hz)")
ylabel("Probability")
Load an audio file of the Für Elise introduction and the sample rate of the audio.
load FurElise.mat song fs
sound(song,fs)
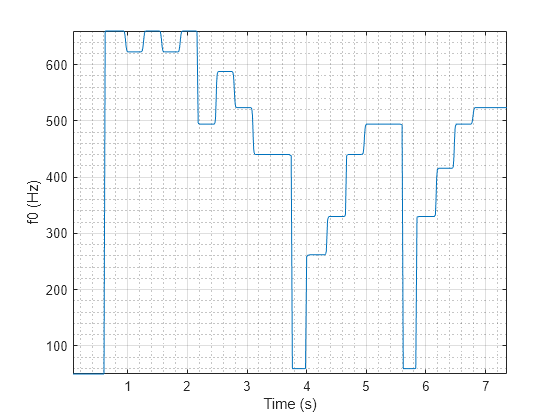
Call the pitch function using the pitch estimate filter (PEF), a search range of 50 to 800 Hz, a window duration of 80 ms, an overlap duration of 70 ms, and a median filter length of 10.
method ="PEF"; range = [
50,
800]; % hertz winDur =
0.08; % seconds overlapDur =
0.07; % seconds medFiltLength =
10; % frames winLength = round(winDur*fs); overlapLength = round(overlapDur*fs); [f0,loc] = pitch(song,fs, ... Method=method, ... Range=range, ... WindowLength=winLength, ... OverlapLength=overlapLength, ... MedianFilterLength=medFiltLength);
Plot the estimated pitch against time.
pitch(song,fs, ...
    Method=method, ...
    Range=range, ...
    WindowLength=winLength, ...
    OverlapLength=overlapLength, ...
    MedianFilterLength=medFiltLength);
Create a dsp.AudioFileReader object to read in audio frame-by-frame.
fileReader = dsp.AudioFileReader("SingingAMajor-16-mono-18secs.ogg");Create a voiceActivityDetector object to detect the presence of voice in streaming audio.
VAD = voiceActivityDetector;
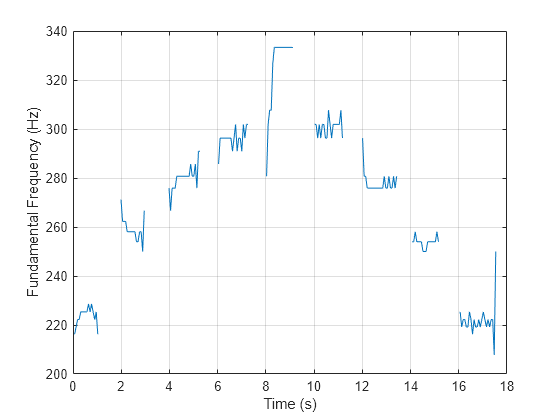
While there are unread samples, read from the file and determine the probability that the frame contains voice activity. If the frame contains voice activity, call pitch to estimate the fundamental frequency of the audio frame. If the frame does not contain voice activity, declare the fundamental frequency as NaN.
f0 = [];
while ~isDone(fileReader)
    x = fileReader();

    if VAD(x) > 0.99
        decision = pitch(x,fileReader.SampleRate, ...
            WindowLength=size(x,1), ...
            OverlapLength=0, ...
            Range=[200,340]);
    else
        decision = NaN;
    end
    f0 = [f0;decision];
end
Plot the detected pitch contour over time.
t = linspace(0,(length(f0)*fileReader.SamplesPerFrame)/fileReader.SampleRate,length(f0));
plot(t,f0)
ylabel("Fundamental Frequency (Hz)")
xlabel("Time (s)")
grid on
The different methods of estimating pitch provide trade-offs in terms of noise robustness, accuracy, optimal lag, and computation expense. In this example, you compare the performance of different pitch detection algorithms in terms of gross pitch error (GPE) and computation time under different noise conditions.
Prepare Test Signals
Load an audio file and determine the number of samples it has. Also load the true pitch corresponding to the audio file. The true pitch was determined as an average of several third-party algorithms on the clean speech file.
[audioIn,fs] = audioread('Counting-16-44p1-mono-15secs.wav');
numSamples = size(audioIn,1);
load TruePitch.mat truePitch
Create test signals by adding noise to the audio signal at given SNRs. The mixSNR function is a convenience function local to this example, which takes a signal, noise, and requested SNR and returns a noisy signal at the request SNR.
testSignals = zeros(numSamples,4);

turbine = audioread('Turbine-16-44p1-mono-22secs.wav');
testSignals(:,1) = mixSNR(audioIn,turbine,20);
testSignals(:,2) = mixSNR(audioIn,turbine,0);

whiteNoiseMaker = dsp.ColoredNoise('Color','white','SamplesPerFrame',size(audioIn,1));
testSignals(:,3) = mixSNR(audioIn,whiteNoiseMaker(),20);
testSignals(:,4) = mixSNR(audioIn,whiteNoiseMaker(),0);
Save the noise conditions and algorithm names as cell arrays for labeling and indexing.
noiseConditions = {'Turbine (20 dB)','Turbine (0 dB)','WhiteNoise (20 dB)','WhiteNoise (0 dB)'};
algorithms = {'NCF','PEF','CEP','LHS','SRH'};
Run Pitch Detection Algorithms
Preallocate arrays to hold pitch decisions for each algorithm and noise condition pair, and the timing information. In a loop, call the pitch function on each combination of algorithm and noise condition. Each algorithm has an optimal window length associated with it. In this example, for simplicity, you use the default window length for all algorithms. Use a 3-element median filter to smooth the pitch decisions.
f0 = zeros(numel(truePitch),numel(algorithms),numel(noiseConditions));
algorithmTimer = zeros(numel(noiseConditions),numel(algorithms));

for k = 1:numel(noiseConditions)
    x = testSignals(:,k);
    for i = 1:numel(algorithms)
        tic
        f0temp = pitch(x,fs, ...
            'Range',[50 300], ...
            'Method',algorithms{i}, ...
            'MedianFilterLength',3);
        algorithmTimer(k,i) = toc;
        f0(1:max(numel(f0temp),numel(truePitch)),i,k) = f0temp;
    end
end
Compare Gross Pitch Error
Gross pitch error (GPE) is a popular metric when comparing pitch detection algorithms. GPE is defined as the proportion of pitch decisions for which the relative error is higher than a given threshold, traditionally 20% in speech studies. Calculate the GPE and print it to the Command Window.
idxToCompare = ~isnan(truePitch);
truePitch = truePitch(idxToCompare);
f0 = f0(idxToCompare,:,:);

p = 0.20;
GPE = mean( abs(f0(1:numel(truePitch),:,:) - truePitch) > truePitch.*p).*100;

for ik = 1:numel(noiseConditions)
    fprintf('\nGPE (p = %0.2f), Noise = %s.\n',p,noiseConditions{ik});
    for i = 1:size(GPE,2)
        fprintf('- %s : %0.1f %%n',algorithms{i},GPE(1,i,ik))
    end
end
GPE (p = 0.20), Noise = Turbine (20 dB).
- NCF : 0.9 %
- PEF : 0.4 %
- CEP : 8.2 %
- LHS : 8.2 %
- SRH : 6.0 %
GPE (p = 0.20), Noise = Turbine (0 dB).
- NCF : 5.6 %
- PEF : 24.5 %
- CEP : 11.6 %
- LHS : 9.4 %
- SRH : 46.8 %
GPE (p = 0.20), Noise = WhiteNoise (20 dB).
- NCF : 0.9 %
- PEF : 0.0 %
- CEP : 12.9 %
- LHS : 6.9 %
- SRH : 2.6 %
GPE (p = 0.20), Noise = WhiteNoise (0 dB).
- NCF : 0.4 %
- PEF : 0.0 %
- CEP : 23.6 %
- LHS : 7.3 %
- SRH : 1.7 %
Calculate the average time it takes to process one second of data for each of the algorithms and print the results.
aT = sum(algorithmTimer)./((numSamples/fs)*numel(noiseConditions));
for ik = 1:numel(algorithms)
    fprintf('- %s : %0.3f (s)\n',algorithms{ik},aT(ik))
end
- NCF : 0.025 (s)
- PEF : 0.062 (s)
- CEP : 0.015 (s)
- LHS : 0.028 (s)
- SRH : 0.047 (s)
Input Arguments
Name-Value Arguments
Output Arguments
Algorithms
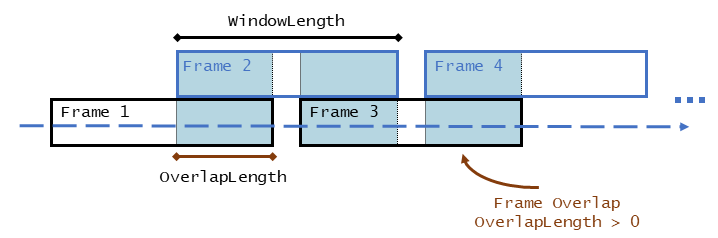
The pitch function segments the audio input according to the
WindowLength and OverlapLength arguments.
The fundamental frequency is estimated for each frame. The locations output,
loc contains the most recent samples (largest sample numbers)
of the corresponding frame.
For a description of the algorithms used to estimate the fundamental frequency, consult the corresponding references:
References
[1] Atal, B.S. "Automatic Speaker Recognition Based on Pitch Contours." The Journal of the Acoustical Society of America. Vol. 52, No. 6B, 1972, pp. 1687–1697.
[2] Gonzalez, Sira, and Mike Brookes. "A Pitch Estimation Filter robust to high levels of noise (PEFAC)." 19th European Signal Processing Conference. Barcelona, 2011, pp. 451–455.
[3] Noll, Michael A. "Cepstrum Pitch Determination." The Journal of the Acoustical Society of America. Vol. 31, No. 2, 1967, pp. 293–309.
[4] Hermes, Dik J. "Measurement of Pitch by Subharmonic Summation." The Journal of the Acoustical Society of America. Vol. 83, No. 1, 1988, pp. 257–264.
[5] Drugman, Thomas, and Abeer Alwan. "Joint Robust Voicing Detection and Pitch Estimation Based on Residual Harmonics." Proceedings of the Annual Conference of the International Speech Communication Association, INTERSPEECH. 2011, pp. 1973–1976.
Extended Capabilities
Version History
Introduced in R2018a