
Peak finding and measurement, 2019
Scripts, functions, and mat files to locate, measure, and fit the peaks and valleys in noisy time-series data sets.
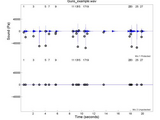
. Determines the position, height, and width of each peak by least-squares curve-fitting. It can find and count over 10,000 peaks per second, and find and measure 1800 peaks per second, in very large signals
- 29.9K (All time)
- 3 (Last 30 days)
- 4.9 / 5
- Community
-
8 Dec 2019

Help you find peak value from a lot of data.
It's a simple function. Can help you find peak value from a lot of datas. It contains some demos.It's my first time to submit file, thanks for your using.
- 28.5K (All time)
- 2 (Last 30 days)
- 4.3 / 5
- Community
-
12 Dec 2003

peaks2 - find peaks in 2D data without additional toolbox
Find peaks in 2D data just as with Matlab's 'findpeaks' function
Fast and effective 2D peak finding algorithm returning peak locations and values. Accepts 2D arrays as an input (for instance, image acquired with a camera from some optics experiment). Various
- 1.3K (All time)
- 14 (Last 30 days)
- 4.3 / 5
- Community
-
12 Apr 2023

Find peaks in vector
Specify a vecter, a minimum peak separation, and a minimum peak height, and this function will find the peaks.. about 250 times faster than findpeaks
- 4.1K (All time)
- 1 (Last 30 days)
- 4.4 / 5
- Community
-
17 Jan 2011

- 10.8K (All time)
- 14 (Last 30 days)
- 5.0 / 5
- Community
-
18 Oct 2010

- 2K (All time)
- 2 (Last 30 days)
- 5.0 / 5
- Community
-
18 Oct 2010

Find local maxima \ peak positions in noisy 2D arrays
fastpeakfindA simple and fast 2D peak finder. The aim was to be faster than more sophisticated techniques yet good enough to find peaks in noisy data. The code analyzes noisy 2D images and find peaks
- 17.6K (All time)
- 3 (Last 30 days)
- 4.9 / 5
- Community
-
21 Apr 2023

Complements find peaks function with the possibility to find all peaks, both local maximums, and local minimums.
Besides complementing find peaks function with the possibility to find all peaks, both local maximums, and local minimums.This also provides a possible workaround for the findpeaks bug pointed out by
- 690 (All time)
- 3 (Last 30 days)
- 5.0 / 5
- Community
-
18 Jan 2020
- 238 (All time)
- 6 (Last 30 days)
- 5.0 / 5
- Community
-
15 Feb 2024

Easily allows you to automatically find, plot, and label local maxima (peaks) and local minima on MATLAB
Easily allows you to automatically find, plot, and label local maxima (peaks) and local minima on MATLABThis code requires the MATLAB Signal Processing Toolbox, which can be downloaded here
- 778 (All time)
- 2 (Last 30 days)
- 5.0 / 5
- Community
-
10 Jun 2022
- 2.2K (All time)
- 9 (Last 30 days)
- 4.0 / 5
- Community
-
20 Jan 2006

Up-sample and filter noisy data to find peaks without using derivatives.
, 2013.peakfind(x_data,y_data)peakfind(x_data,y_data,upsam)peakfind(x_data,y_data,upsam,gsize,gstd)peakfind(x_data,y_data,upsam,htcut,'cuttype')peakfind(x_data,y_data,upsam,gsize,gstd,htcut,'cuttype')[xpeaks]=peakfind()[xout,yout,peakspos]=peakfind()This function finds peaks without taking first or second derivatives, rather it uses local slope features in a given data set. The function has four basic modes. Mode 1: peakfind(x_data,y_data) simply
- 2.8K (All time)
- 3 (Last 30 days)
- 5.0 / 5
- Community
-
9 Jul 2013

Keypress operated interactive peak detector function.
ipeak(DataMatrix,PeakD,AmpT,SlopeT,SmoothW,FitW,xcenter,xrange,MaxError,positions,names)iPeak is a keyboard-operated Interactive Peak Finder for time series data. Expected input forms: ipeak(y); %
- 7.3K (All time)
- 2 (Last 30 days)
- 4.8 / 5
- Community
-
4 May 2016

2D Finite Element Global Digital Image Correlation (FE-DIC)
Finite-element-based global DIC method (guarantee global kinematic compatibility and decrease noise by adding regularization penalties).
- 2.5K (All time)
- 8 (Last 30 days)
- 5.0 / 5
- Community
-
20 Jan 2024

Augmented Lagrangian Digital Image Correlation and Tracking
2D-AL-DIC(Augmented Lagrangian DIC) is a fast, parallel-computing DIC algorithm which also considers global kinematic compatibility.
- 4.1K (All time)
- 16 (Last 30 days)
- 5.0 / 5
- Community
-
26 Mar 2024

- 5.6K (All time)
- 1 (Last 30 days)
- 4.0 / 5
- Community
-
27 Sep 2010

Finding Dominant Peaks and Valleys of an Image Histogram
This function finds dominant peaks and local valleys of an image histogram
This function finds dominant peaks and valleys of an image histogram. Minimum peak distance and averaging filter size can be changed to suit your need. Although, the function is originally written
- 1.7K (All time)
- 1 (Last 30 days)
- 4.4 / 5
- Community
-
25 May 2011

- 2.2K (All time)
- 2 (Last 30 days)
- 4.0 / 5
- Community
-
1 Sep 2016

IMF for Bearing Fault Diagnosis
performs HHT on signal & IMF is plotted for Condition monitoring of vibration based bearing fault
- 4.8K (All time)
- 6 (Last 30 days)
- 4.8 / 5
- Community
-
19 Jun 2012
- 43.3K (All time)
- 5 (Last 30 days)
- 4.7 / 5
- Community
-
31 Mar 2016

Estimates the location and magnitude of the peak of a continuous function between samples.
Sometimes it is important to be able to estimate the peak of a sampled continuous function between the samples. This is called subsample peak interpolation and is used in radar, delay estimation, and
- 3.1K (All time)
- 1 (Last 30 days)
- 5.0 / 5
- Community
-
17 Jun 2009

Real-Valued Spherical Harmonics
some useful spherical harmonics routines
function valuesf(theta,phi) and the derivativesof f w.r.t theta and phi. Can be usedfor finding peaks of spherical functions[4] implement the spherical harmonics rotation algorithm of Ivanic and Ruedenberg
- 3.3K (All time)
- 1 (Last 30 days)
- 4.0 / 5
- Community
-
10 Apr 2016
Matlab toolbox for separation techniques hyphenated high resolution mass spectrometry
a software, it is a collection of classes and functions that allow recovering MS scans from mzML files and performed transformation (baseline drift correction, peak picking, centroid algorithms…), As
- 224 (All time)
- 2 (Last 30 days)
- 4.0 / 5
- Community
-
21 Apr 2022
Find local peaks or troughs in a vector
NOTE: this function is now available from the IoSR Matlab Toolbox as iosr.dsp.localpeaks. ------------------------- LOCALPEAKS Find local peaks and troughs in a vector SYNTAX peaks =
- 3.2K (All time)
- 1 (Last 30 days)
- 4.9 / 5
- Community
-
11 Aug 2016

peaks - 1D peak finding without Signal Processing Toolbox
Find peaks in 1D data | Matlab findpeaks equivalent
Peak finding algorithm for essential signal processing. Returns peak amplitudes and locations. Various filters can be selected such as minimal absolute value, threshold above the immediate
- 96 (All time)
- 2 (Last 30 days)
- -- / 5
- Community
-
3 Apr 2023

peakfinder(x0, sel, thresh, extrema, includeEndpoints, interpolate)
Quickly finds local maxima (peaks) or minima (valleys) in a noisy signal.
This function quickly finds local peaks or valleys (local extrema) in a noisy vector using a user defined magnitude threshold to determine if each peak is significantly larger (or smaller) than the
- 38.7K (All time)
- 8 (Last 30 days)
- 4.8 / 5
- Community
-
2 Oct 2016
Find Peaks of the signal and stores the answer in excel
find peaks program to find peaks i have faced problem in findpeaks.m so i have made my code to find peaks of the signal. it find peaks of the signal from excel file and stores peaks value in excel
- 631 (All time)
- 1 (Last 30 days)
- -- / 5
- Community
-
29 Jul 2013
Finds peaks, locations, fwhms and area in signal.
Very lean an simple code that automatically finds major peaks, their locations, fwhms and area in a given signal y versus x. Requires no input parameters. The output is a matrix with peaks sorted in
- 6.6K (All time)
- 2 (Last 30 days)
- 4.0 / 5
- Community
-
10 Jun 2008

Easy clustering of a vector into groups
Automatic find peaks and associate each point to a peak in a vector
function [peaks,groups,criterion] = peaksandgroups(V,select,display)% -------------------------------------------------------------% Find peaks and link each data point to a peak, in effect
- 793 (All time)
- 1 (Last 30 days)
- 5.0 / 5
- Community
-
12 Nov 2013
Find peaks (maxima and minima) of a function
This function detects the transition points (maxima and minima) in a function like y = f(x)
function [nmax,maxAt,maxValues,nmin,minAt,minValues] = peak(y,x,threshold,stepsize)This function detects the transition points (maxima and minima) of a function like y = f(x), where x is indpendent
- 708 (All time)
- 2 (Last 30 days)
- -- / 5
- Community
-
28 Jan 2016
- 2.3K (All time)
- 1 (Last 30 days)
- 5.0 / 5
- Community
-
25 Sep 2012

- 2.1K (All time)
- 2 (Last 30 days)
- -- / 5
- Community
-
24 Sep 2010

- 1.5K (All time)
- 1 (Last 30 days)
- -- / 5
- Community
-
3 Oct 2010

This exercise shows how the method of linear predictive coding (LPC) models a speech frame.
- 1.4K (All time)
- 3 (Last 30 days)
- 5.0 / 5
- Community
-
2 Jun 2015

This exercise computes the frequency response of a p-tube model of a human vocal tract.
- 977 (All time)
- 1 (Last 30 days)
- 5.0 / 5
- Community
-
23 Jun 2015
- 8 (All time)
- 2 (Last 30 days)
- -- / 5
- Community
-
10 Jul 2022

Find peaks for a given 2D curve.
The code is very simple and needs only two lines of code.
Full call: PeakValues=FindPeaksSimple(x,y,PeakType,Interpolate) INPUT: 1 x: x-values. Vector with numbers. 2 y: y-values. Vector with numbers. Optional values: You may omit all off them or the
- 57 (All time)
- 1 (Last 30 days)
- -- / 5
- Community
-
21 Jul 2022

Produce an array of responses from a fourth-order Gammatone filter via FFT
align=true, fine structure and envelope alignment is applied so that the impulse response peaks occurs at t=0.[bm,env] = gammatoneFast(...) returns the instantaneous envelopes env for each filter.[bm,env,delay
- 3.4K (All time)
- 3 (Last 30 days)
- 5.0 / 5
- Community
-
11 Aug 2016

Impulse response acoustic information calculator
Calculate RT, DRR, Cte, and EDT for impulse response file
) will be returned for each channel. The function returns a 1xN vector of RTs, where N is the number of channels in the audio file. The function determines the direct sound as the peak of the squared
- 4.4K (All time)
- 3 (Last 30 days)
- 5.0 / 5
- Community
-
11 Aug 2016

- 2K (All time)
- 2 (Last 30 days)
- 5.0 / 5
- Community
-
11 Aug 2016
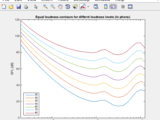
ISO 226:2003 Normal equal-loudness-level contours
Return sound pressure levels of pure tone frequencies at specified loudness level(s).
- 1.2K (All time)
- 2 (Last 30 days)
- 5.0 / 5
- Community
-
11 Aug 2016

- 900 (All time)
- 2 (Last 30 days)
- 5.0 / 5
- Community
-
11 Aug 2016

Find sub-sample location of global maximum in a 2-dimensional numerical matrix.
This small contribution is useful in cases where you search for the position of a peak within an intensity matrix (correlation or energy fields) of low resolution. Since this is only a 2nd-order-fit
- 1.3K (All time)
- 3 (Last 30 days)
- 5.0 / 5
- Community
-
28 Jan 2010

Data import and peak search
MATLAB script which can be used to complete a peak search on a spectrum trace extracted from an RSA6100A Real-Time Spectrum Analyzer. Definable Parameters - Start Frequency- Stop Frequency- RBW
- 1.3K (All time)
- 1 (Last 30 days)
- -- / 5
- Community
-
26 Oct 2007

- 12 (All time)
- 2 (Last 30 days)
- -- / 5
- Community
-
2 Oct 2024

- 77 (All time)
- 1 (Last 30 days)
- -- / 5
- Community
-
20 Jan 2023

- 10.9K (All time)
- 3 (Last 30 days)
- 4.7 / 5
- Community
-
28 Jun 2017

- 1.6K (All time)
- 1 (Last 30 days)
- 4.7 / 5
- Community
-
11 Aug 2016
Function for finding peaks from data array
Function helps in finding the peaks more effectively than findpeaks() defined in Matlab library.
I was not able to get the peaks from my experimentally obtained data because of its random nature. As a result the findpeaks() defined in Matlab library was not giving results as expected. Hence I
- 1.1K (All time)
- 1 (Last 30 days)
- -- / 5
- Community
-
20 Jun 2010

Find peaks in data using a scale-space approach. It is efficient and requires very few parameters.
-------------------------------------------------------------Scale-space peak picking------------------------This function looks for peaks in the data using scale-space theory. input : * V : data
- 2.6K (All time)
- 3 (Last 30 days)
- 5.0 / 5
- Community
-
20 Jan 2015
- 1.4K (All time)
- 1 (Last 30 days)
- -- / 5
- Community
-
20 Jul 2009

- 367 (All time)
- 8 (Last 30 days)
- 5.0 / 5
- Community
-
13 Feb 2024

- 464 (All time)
- 3 (Last 30 days)
- 5.0 / 5
- Community
-
17 Jun 2016

Visualization and analysis of an Electrocardiogram Signal
Live Script shows how to find data peaks from EKG, how to refine peaks from data, and infer heart rate from peaks of Electrocardiogram data
The Electrocardiogram Live Script uses the Signal Processing Toolbox to find peaks of data from an EKG and shows how to refine the peaks based on your data. The Live Script also shows how to gather
- 2.4K (All time)
- 5 (Last 30 days)
- 4.3 / 5
- Community
-
18 Jul 2018

A Hough transform function for detecting circles, optimised to allow search over radii.
for different radii.Multiple circles may be detected by finding peaks in the 3D accumulator array. A function, circle_houghpeaks, is provided for this. A demonstration of the two functions is included
- 22.7K (All time)
- 4 (Last 30 days)
- 4.6 / 5
- Community
-
4 Mar 2016

Signal Optimal Smoothing Techniques
Producing high- and low-resolution smoothers by means of Spectral Analysis
- 775 (All time)
- 1 (Last 30 days)
- -- / 5
- Community
-
2 May 2017
- 125 (All time)
- 5 (Last 30 days)
- -- / 5
- Community
-
23 Sep 2024

Fast Checkerboard Demodulation for digital Schlieren imaging
Track optical distortions in a checkerboard pattern with high accuracy in real-time using the FCD method
- 386 (All time)
- 2 (Last 30 days)
- 5.0 / 5
- Community
-
9 Dec 2018

Calculate the long-term average spectrum of a signal
LTAS for each corresponding row/column/etc. S = LTAS(X,FS,'PARAMETER','VALUE') allows numerous parameters to be specified. These parameters are:- 'dim' : {find(size(X)>1,1,'first')} | scalar
- 1.1K (All time)
- 3 (Last 30 days)
- 4.3 / 5
- Community
-
11 Aug 2016
This function finds the peaks between sign changes
% This function simply finds the peak of a signal between a sign change.% This is the peak of a two sided signal. There is only one input % which is the array. If you had data from an
- 254 (All time)
- 1 (Last 30 days)
- -- / 5
- Community
-
18 Jun 2012