freezeColors / unfreezeColors
Editor's Note: This file was selected as MATLAB Central Pick of the Week
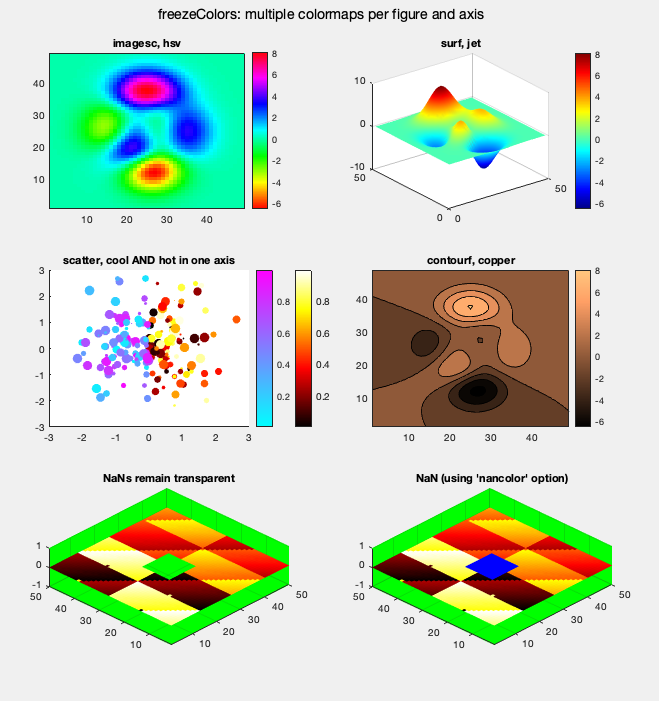
freezeColors allows multiple colormaps to be used per figure and even within a single axis.
In 2005 freezeColors was written to enable multiple colormaps in a single figure, something MATLAB could not do. It was a file exchange pick of the week in 2009.
In 2014, MATLAB enabled each axis to have its own colormap. However, freezeColors still had a following because it was more flexible and enabled multiple colormaps within a single axis as well.
As MATLAB's graphics are continually evolving, over time freezeColors stopped working in some situations, such as with colorbars. Now, in 2022, it's been brought back up to date and will hopefully work in every use people have in mind. If not, let me know and I'll try to fix it.
2022 Changes (v. 2.5)
* greater emphasis on multiple colormaps within a single axis
* new method for freezing colorbars
* scatter works properly
* works properly when calling freezeColors(axesHandle)
* includes a replacement for colorbar: jicolorbar
freezeColors            applies to all objects in current axis
freezeColors(axh)       same, but works on objects in axis axh.
freezeColors(colorbar)  creates a colorbar frozen to the current colormap
subplot(2,1,1); imagesc(peaks); colormap hot; freezeColors; freezeColors(colorbar)
subplot(2,1,2); imagesc(peaks); colormap hsv; freezeColors; freezeColors(colorbar) %etc...
Note, in such a simple case, this could just as well use matlab's per-axis colormaps (2014 and later):
subplot(2,1,1); imagesc(peaks); colorbar; colormap(gca,'hot')
subplot(2,1,2); imagesc(peaks); colorbar; colormap(gca,'hsv')
Here is an example (from test/test_main.m) also showing one scatterplot panel using multiple colormaps in a single axis.
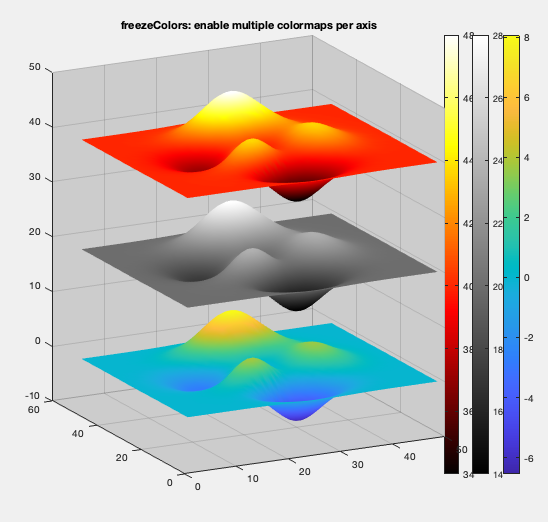
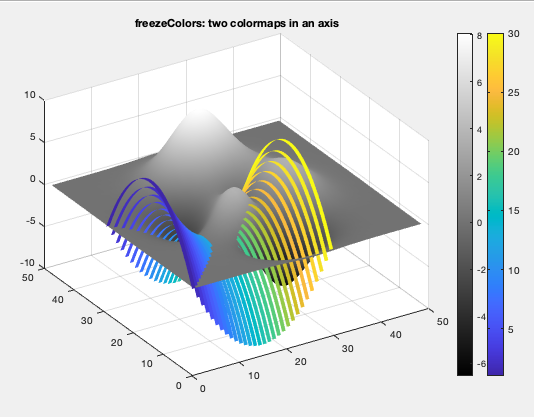
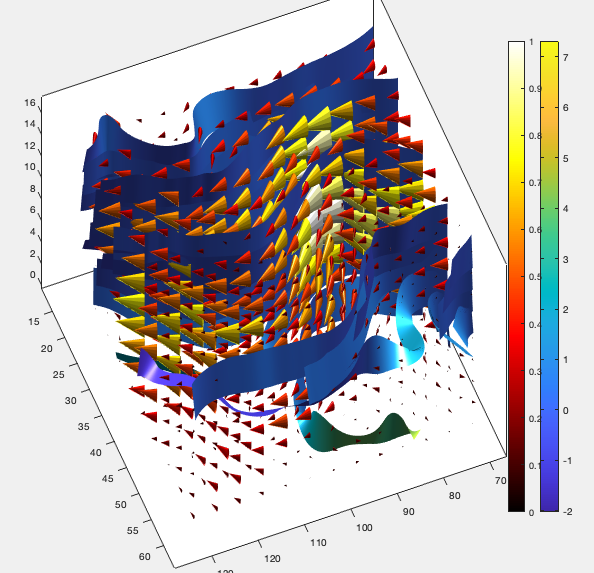
freezeColors can do something that some people need and not possible currently in MATLAB: having objects using multiple different colormaps within the same axis. These examples are somewhat contrived, but illustrate the possibilities.
figure
surf(peaks); colormap parula; freezeColors; freezeColors(jicolorbar); hold on
surf(peaks+20); caxis([14 28]); colormap gray; freezeColors; freezeColors(colorbar);
surf(peaks+40); caxis(caxis+20); colormap hot; freezeColors; freezeColors(jicolorbar('horiz'));
axis auto; shading interp; caxis([14 28]); view([-27 14]); set(gca,'color',[.8 .8 .8])
Example with surf and ribbon
Example with streamribbon and coneplot
See test/test_main.m for more examples.
The color of some graphic objects in MATLAB is controled by a CData property (surf, image, scatter, patch, coneplot, streamribbon, etc), which is usually converted to color using
the current colormap using a scaling process. Thus if the colormap changes, the appearance changes. freezeColors simply converts
all graphics objects from scaled CData to direct RGB CData meaning its appearance is 'frozen' to the current colormap and thus
subsequent changes to the colormap will not change its appearance. The original scaled data are stored and can be restored using unfreezeColors.
In its continued quest for improvement, some graphics objects change over time, foremost among them colorbars, which used to be
implemented as images and thus could easily be frozen along with other objects. Nowadays they are encapsulated in an opaque object and
we needed to find a new way to freeze them. Now simply call freezeColors(colorbar)
to add a 'frozen' colorbar to an axis. It will appear to unfreeze when you change colormaps, but the next call to freezeColors will
restore its frozen appearance. It will not be frozen to the caxis, so be aware of that.
It's a workaround, but just remember to call freezeColors after you change the colormaps and
all will be well. This has the benefit of also freezing contourf plots, as long as you call freezeColors(colorbar) after the plot.
Also, having multiple colorbars in an axis is a work in progress--a combination of jicolorbar and colorbar were used in the examples and required some attention to setting the caxis; a more sustainable solution would be a new version of jicolorbar that more easily enables multiple (frozen) colorbars per axis...
Cite As
John Iversen (2025). freezeColors / unfreezeColors (https://github.com/jiversen/freezeColors/releases/tag/v2.5), GitHub. Retrieved .
MATLAB Release Compatibility
Platform Compatibility
Windows macOS LinuxCategories
Tags
Acknowledgements
Inspired: newcolorbar: multiple colormaps in the same axes, cbarrow: pointy ends for colorbars, Simple Robotics Toolbox, Easy Plot EEG Brain Network Matlab, Plot multiple surfaces multisurf(x,y,z,color), Anatomical data visualization toolfbox for fMRI/ECoG, Shaded pseudo color, imagescnan.m v2.1 (Aug 2009), COLORMAP and COLORBAR utilities (Jul 2014), Multiple Colormaps, STATMASK: Overlay image with coloured statistical mask, Neural Data Toolbox (NDTb), rgbmap color maps, LSWAVE-SignalProcessing, Automated phenotyping of mouse behavior, Medical Image Reader and Viewer
Community Treasure Hunt
Find the treasures in MATLAB Central and discover how the community can help you!
Start Hunting!Discover Live Editor
Create scripts with code, output, and formatted text in a single executable document.
test
| Version | Published | Release Notes | |
|---|---|---|---|
| 2.5 | See release notes for this release on GitHub: https://github.com/jiversen/freezeColors/releases/tag/v2.5 |
||
| 1.3.0.0 | Change documentation to suggest using cbfreeze to freeze colorbars
|
||
| 1.1.0.0 | Added workaround for problem freezing colorbars |
||
| 1.0.0.0 | Improved: Published documentation & demo.
|


