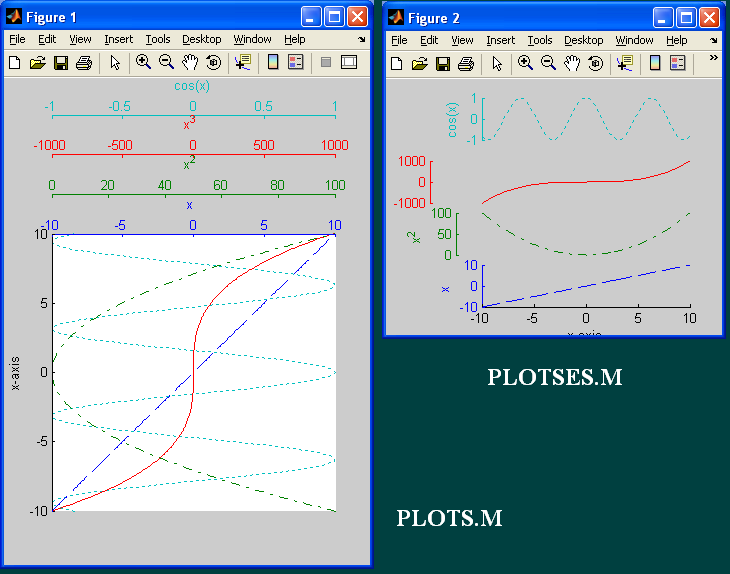
plots.m, plotses.m
Plots each column of a matriz vs a single axis. Improvement of plotyyy.

You are now following this Submission
- You will see updates in your followed content feed
- You may receive emails, depending on your communication preferences
Cite As
Carlos Adrian Vargas Aguilera (2026). plots.m, plotses.m (https://nl.mathworks.com/matlabcentral/fileexchange/10242-plots-m-plotses-m), MATLAB Central File Exchange. Retrieved .
Acknowledgements
Inspired by: plotyyy
Inspired: addaxes.m v1.1 (Sep 2009), ecopath_matlab: A Matlab implementation of Ecopath, xunits, yunits and zunits.m (Jul 2014)
General Information
- Version 1.0.0 (34.7 KB)
MATLAB Release Compatibility
- Compatible with any release
Platform Compatibility
- Windows
- macOS
- Linux
| Version | Published | Release Notes | Action |
|---|---|---|---|
| 1.0.0 | BSD License |

