CUDA Code from CWT
R2026bThis example shows how to generate a MEX file to perform the continuous wavelet transform (CWT) using generated CUDA® code.
First, ensure that you have a CUDA-enabled GPU and the NVCC compiler. See The GPU Environment Check and Setup App (GPU Coder) to ensure you have the proper configuration.
Create a GPU coder configuration object.
cfg = coder.gpuConfig("mex");Create a signal that consists of two sinusoids with disjoint time support. Sample the signal for 100 seconds. The sample rate is 1000 Hz. The result is a signal with 100,000 samples.
Fs = 1e3;
t = 0:1/Fs:100-1/Fs;
x = cos(2*pi*32*t).*(t>10 & t<=50)+ ...
    cos(2*pi*64*t).*(t>=60 & t<90)+ ...
    0.2*randn(size(t));
plot(t,x)
title("Signal")
xlabel("Time (s)")
ylabel("Amplitude")
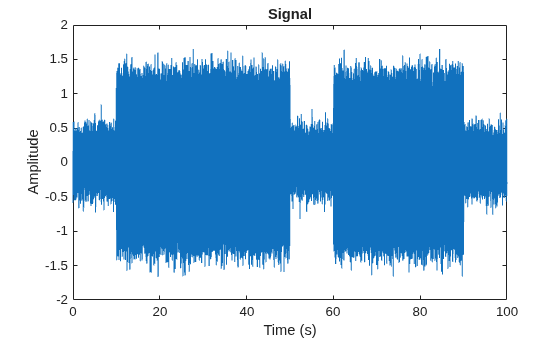
Cast the signal to use single precision. GPU calculations are often more efficiently done in single precision. You can generate code for double precision if your NVIDIA® GPU supports it.
x = single(x);
Generate the GPU MEX file. In order to do so, you must specify the properties (class, size, and complexity) of the three input parameters: input signal, wavelet name, and sample rate:
coder.typeof(single(0),[1 1e5])specifies a row vector of length 100,000 containing realsinglevalues.coder.Constant("morse")specifies the wavelet name"morse"as a compile-time constant.coder.typeof(0)specifies a realdoublevalue.
sig = coder.typeof(single(0),[1 1e5]);
wname = coder.Constant("morse");
srate = coder.typeof(0);
codegen cwt -config cfg -args {sig,wname,srate} % -report
Code generation successful.
The -report flag is optional. Using -report generates a code generation report. In the Summary tab of the report, you can find a GPU code metrics link, which provides detailed information such as the number of CUDA kernels generated and how much memory was allocated.
Run the MEX file on the data and plot the scalogram. Confirm the plot is consistent with the two disjoint cosine waves.
[cfs,f] = cwt_mex(x,"morse",Fs);
figure
image("XData",t,"YData",f,"CData",abs(cfs),"CDataMapping","scaled")
set(gca,"YScale","log")
axis tight
xlabel("Time (Seconds)")
ylabel("Frequency (Hz)")
title("Scalogram of Two-Tone Signal")
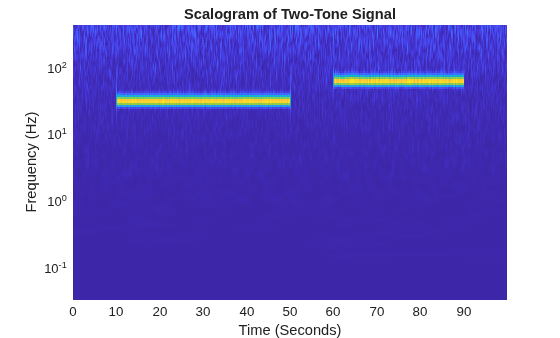
Execute the function cwt with the same input arguments. Confirm the MATLAB® and the GPU MEX scalograms are identical.
[cfs2,f2] = cwt(x,"morse",Fs);
max(abs(cfs2(:)-cfs(:)))
ans = single
7.5218e-07

