Add Custom Functions in Flight Log Analyzer App to Detect Region of Interest for Analysis
This example shows how to create and add custom functions in the Flight Log Analyzer app to detect a specific region or point of interest for further analysis. These functions can be useful when analyzing several log files or a single large log file.
For example, if a well-controlled flight has good tracking of the desired roll, pitch, and yaw angles, you can visualize them by plotting the desired versus the estimated angles. You can use a custom function to track the difference and show the regions where the difference is more than the threshold value. You can further investigate those regions by examining other logged signals like actuator outputs and EKF estimates at those instances.
Open Flight Log Analyzer App
In the Apps tab, under Robotics and Autonomous Systems, select Flight Log Analyzer.
Alternatively, you can use the flightLogAnalyzer command from the MATLAB® command prompt.
Import ULOG File
Load a ULOG file into the workspace.
ulg = ulogreader("flight.ulg")ulg =
ulogreader with properties:
FileName: "flight.ulg"
StartTime: 00:00:00.176000
EndTime: 00:02:15.224000
AvailableTopics: [51x5 table]
DropoutIntervals: [0x2 duration]
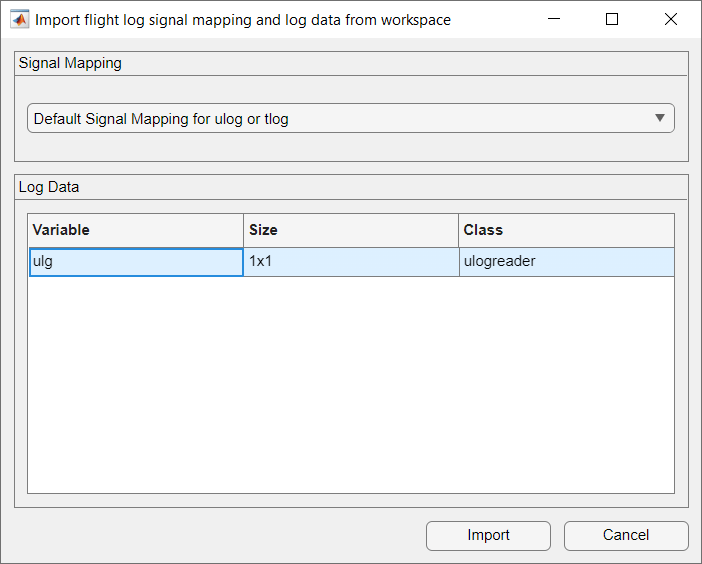
On the Flight Log Analyzer app toolstrip, select Import > From Workspace. In the Log Data section of the Import flight log signal mapping and log data from workspace dialog box, select the ulogreader object ulg and click Import.
Add Annotation Function
To add a custom function to the Flight Log Analyzer app:
In the Annotate section of the app toolstrip, click Add Function.
In the dialog box, specify the Function name as
ComputeTrackingError.Specify the Label type as ROI.
Click OK.
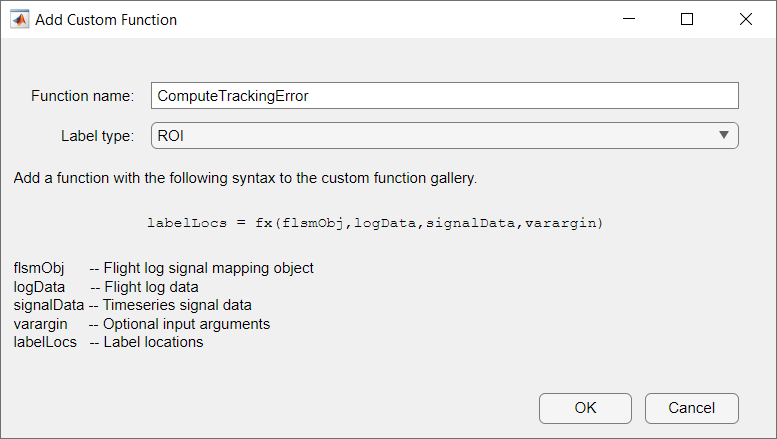
The ComputeTrackingError function appears in the gallery in the Annotate section, because the function has already been provided with this example and is on the MATLAB path.
If the function does not exist on the MATLAB path, the app suggests to create a new function and opens a function template in the MATLAB editor. If the function is at a different location, you must add the location to the MATLAB path.
The function can access the flightLogSignalMapping object, the complete flight log data, the selected signals, and the additional optional arguments from the app.
Run Annotation Function
Run the ComputeTrackingError annotation function to find the regions with a tracking error greater than the threshold value.
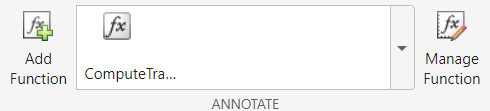
In the Annotate gallery, click
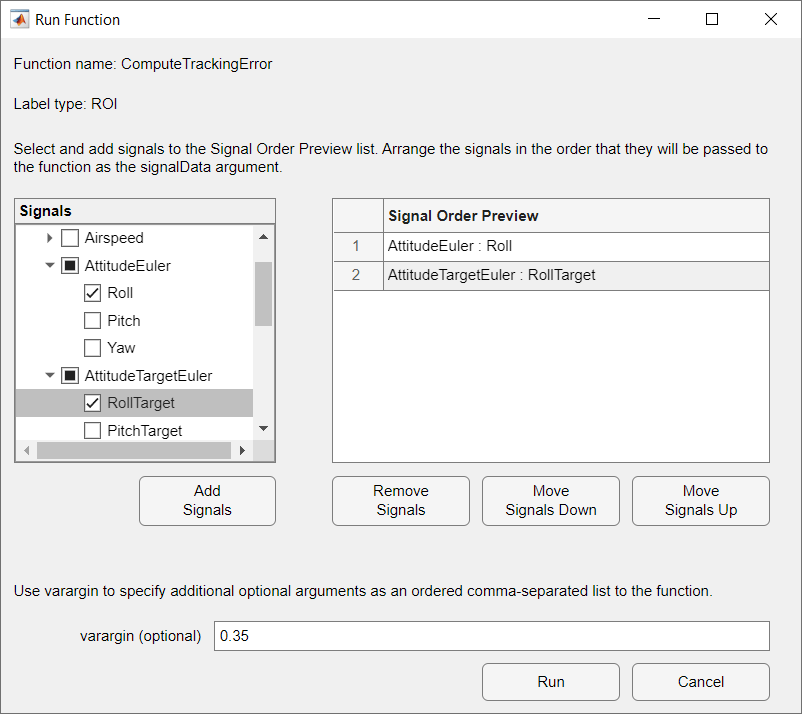
ComputeTrackingError.In the dialog box, select the required signals from the Signals pane.
Expand
AttitudeEulerand selectRoll.Expand
AttitudeTargetEulerand selectRollTarget.Click Add Signals. The added signals are listed in the Signal Order Preview pane.
For varargin, specify a threshold value of
0.35.Click Run.
Repeat these steps, but selecting
PitchandPitchTargetorYawandYawTarget, respectively.
You can rearrange the order of the signals passed to the function using Move Signals Down and Move Signals Up. You can also remove the signals using Remove Signals.
Create Figures and Plots
Create custom Timeseries plots to compare the estimated roll, pitch, and yaw angles against their corresponding desired angles.
In the Plot section of the app toolstrip, click Add Figure to add an empty figure to the plotting pane.
In the Custom Plots section of the plot gallery, select Timeseries.
In the Details pane, rename the plot to
Roll (estimated vs setpoint).In the Signals pane, click Add Signal twice to add two signals.
Double-click the Y-Axis column of the first signal and, in the Signal Browser window, type
Rollin the Search box. ExpandAttitudeEulerand selectRoll. Then, click Update.Double-click the Y-Axis column of the second signal and, in the Signal Browser window, type
RollTargetin the Search box. ExpandAttitudeTargetEulerand selectRollTarget. Then, click Update.Rename the first signal to
Estimated Rolland the second signal toSetpoint Roll. To rename a signal, double-click its entry in the Signal Name column and type the new name.Repeat the steps 2 to 7, but selecting
PitchandPitchTargetorYawandYawTarget, respectively.
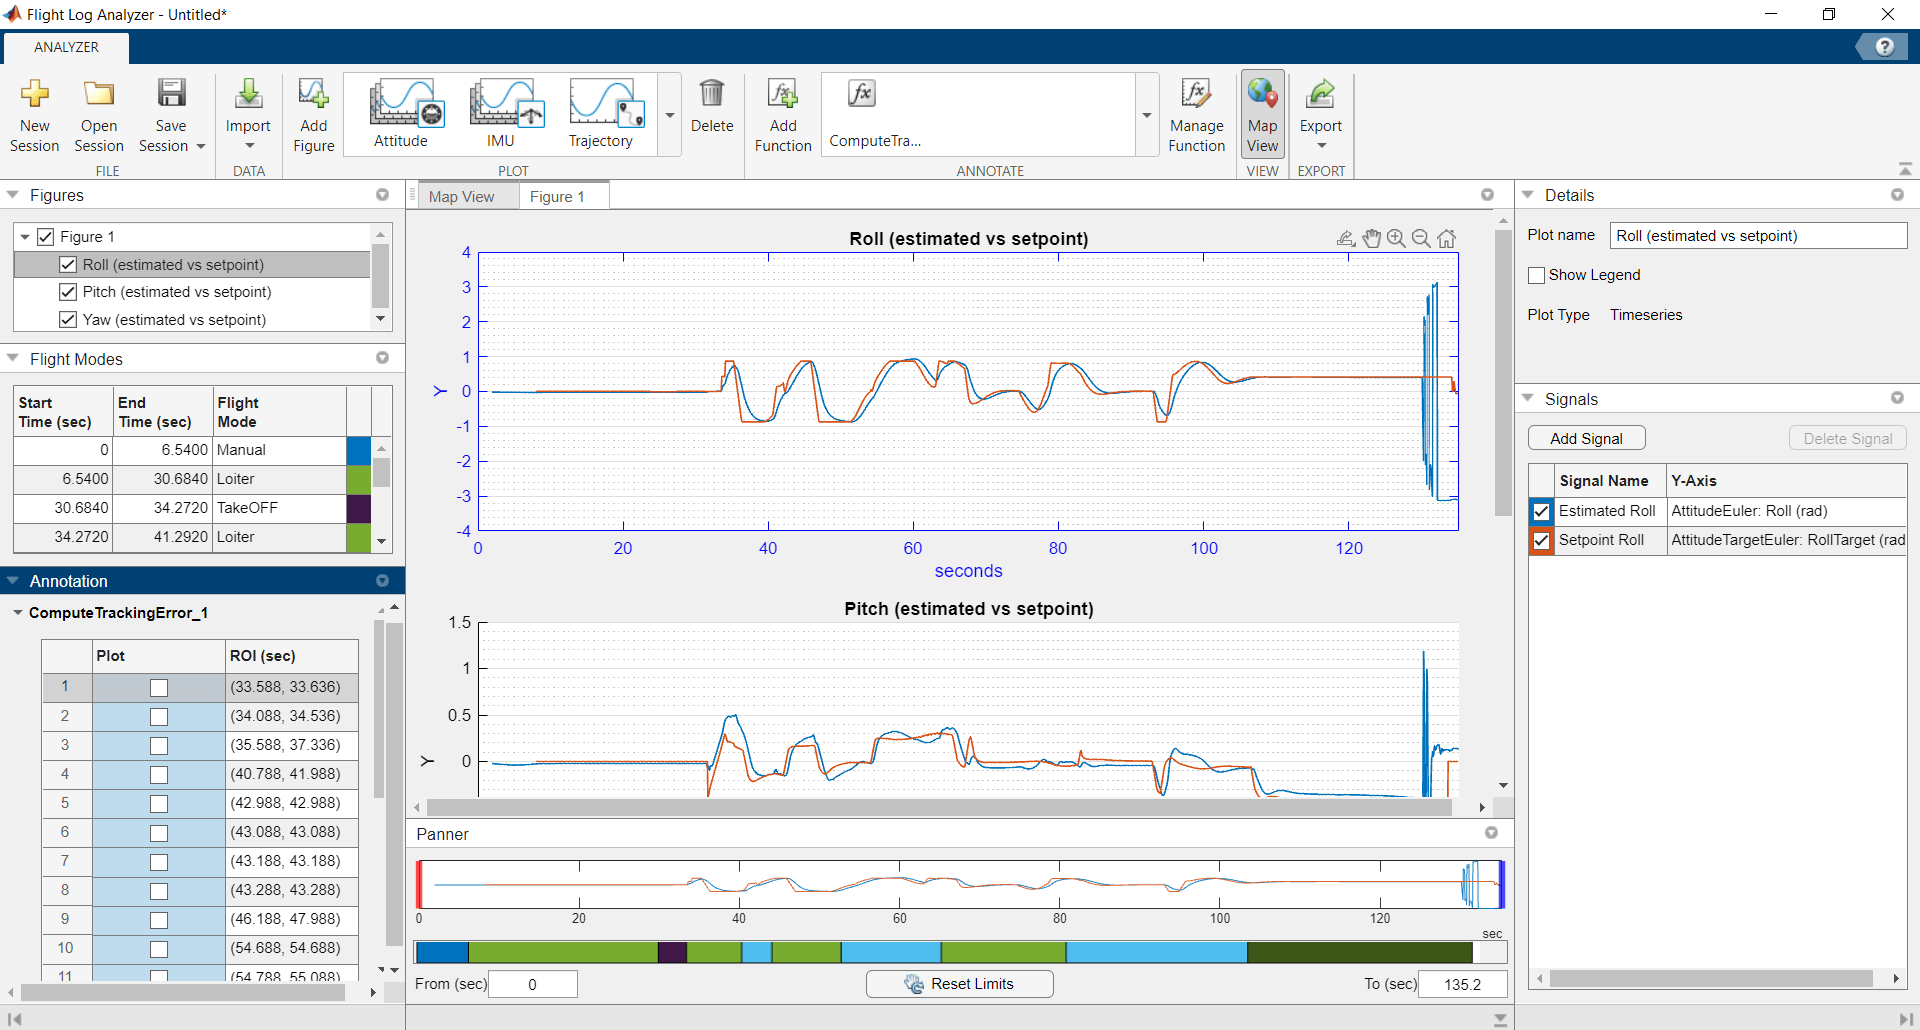
Annotate Plots
In the Figures pane, select the plot on which you want to see the detected region of interest.
In the Annotation pane, select the ROIs to highlight the regions on the plot with tracking error greater than the specified threshold value.
To rename the default annotation label, right-click the label and select Rename Label. Then, type the new label name.

Export Signals and Annotations as Labeled Signal Set
Export the annotations and selected signals as a labeledSignalSet object.
In the Export section of the app toolstrip, click Export > Export to LabeledSignalSet.
Specify a variable name for the
labeledSignalSetobject.Specify a name for the flight log label.
Select at least one signal to export to the
labeledSignalSetobject.Select the annotations to export.
Click Export.
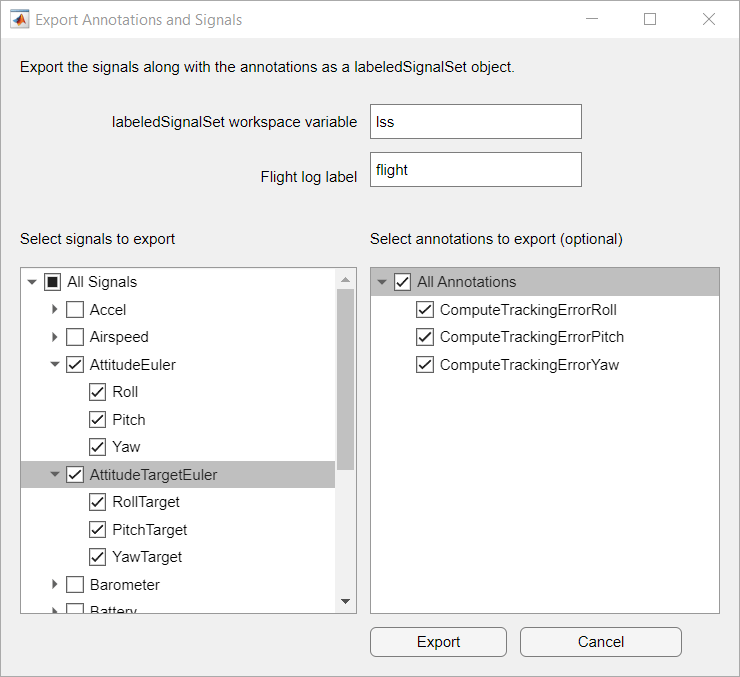
You can open the labeledSignalSet object in the workspace or in the Signal Labeler app. You can use the time-frequency plots for analysis or to correct some of the annotations, which you can then be use for machine learning-based anomaly detection.
Select a Web Site
Choose a web site to get translated content where available and see local events and offers. Based on your location, we recommend that you select: United States.
You can also select a web site from the following list
Americas
- América Latina (Español)
- Canada (English)
- United States (English)
Europe
- Belgium (English)
- Denmark (English)
- Deutschland (Deutsch)
- España (Español)
- Finland (English)
- France (Français)
- Ireland (English)
- Italia (Italiano)
- Luxembourg (English)
- Netherlands (English)
- Norway (English)
- Österreich (Deutsch)
- Portugal (English)
- Sweden (English)
- Switzerland
- United Kingdom (English)
Asia Pacific
- Australia (English)
- India (English)
- New Zealand (English)
- 中国
- 日本Japanese (日本語)
- 한국Korean (한국어)