rcoplot
Residual case order plot
Description
Examples
Plot a residual case order plot by using the rcoplot function. This type of plot can help you identify outliers.
Load the moore data set, which contains the biochemical oxygen demand on five predictors.
load mooreFit a linearly additive regression model to the data by using the regress function.
X = [ones(size(moore,1),1) moore(:,1:5)];
y = moore(:,6);
alpha = 0.05;
[beta,betaInt,residual,residualInt,stats] = regress(y,X,alpha);
Plot the residuals and prediction intervals from the model.
rcoplot(residual,residualInt)
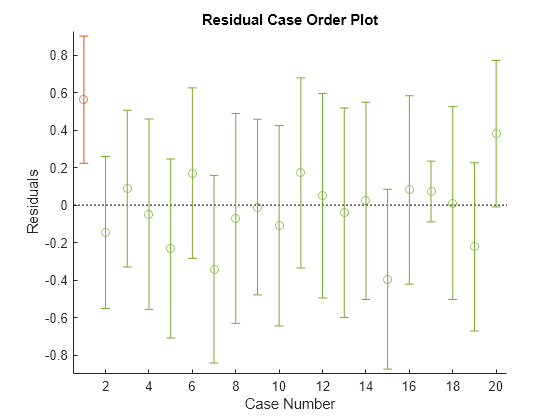
The interval around the first residual, shown in red, does not contain zero. This result indicates that the residual is larger than expected in 95% of new observations, and suggests that the data point is an outlier.