onehotdecode
Description
A = onehotdecode(B,classes,featureDim)B to the most probable class label from the labels specified by classes. featureDim specifies the dimension along which the probability vectors are defined. The function decodes the probability vectors into class labels by matching the position of the highest value in the vector with the class label in the corresponding position in classes. Each probability vector in A is replaced with the value of classes that corresponds to the highest value in the probability vector.
Examples
Encode a set of labels into probability vectors, and then decode them back into labels.
Create a vector of categorical labels specifying color types.
colorsOriginal = ["red","blue","red","green","yellow","blue"];
colorsOriginal = categorical(colorsOriginal)
colorsOriginal = 1×6 categorical
     red      blue      red      green      yellow      blue
Determine the classes in the categorical vector.
classes = categories(colorsOriginal)
classes = 4×1 cell
    {'blue'  }
    {'green' }
    {'red'   }
    {'yellow'}
One-hot encode the labels into probability vectors by using the onehotencode function. Encode the labels into the first dimension, so that each row corresponds to a class and each column corresponds to a probability vector.
colorsEncoded = onehotencode(colorsOriginal,1)
colorsEncoded = 4×6

     0     1     0     0     0     1
     0     0     0     1     0     0
     1     0     1     0     0     0
     0     0     0     0     1     0
Decode the probability vectors by using the onehotdecode function.
colorsDecoded = onehotdecode(colorsEncoded,classes,1)
colorsDecoded = 1×6 categorical
     red      blue      red      green      yellow      blue
The decoded labels match the original labels.
Create dummy variables, and then decode them back into the original data.
Create a column vector of categorical data specifying color types.
colorsOriginal = ["red";"blue";"red";"green";"yellow";"blue"];
colorsOriginal = categorical(colorsOriginal)
colorsOriginal = 6×1 categorical
     red
     blue
     red
     green
     yellow
     blue
Determine the classes in the categorical vector.
classes = categories(colorsOriginal);
Create dummy variables for each color type by using the dummyvar function.
dummyColors = dummyvar(colorsOriginal)
dummyColors = 6×4

     0     0     1     0
     1     0     0     0
     0     0     1     0
     0     1     0     0
     0     0     0     1
     1     0     0     0
Decode the dummy variables in the second dimension by using the onehotdecode function.
colorsDecoded = onehotdecode(dummyColors,classes,2)
colorsDecoded = 6×1 categorical
     red
     blue
     red
     green
     yellow
     blue
The decoded variables match the original color types.
Decode a set of probability vectors into the most probable class for each observation.
Create a set of 10 random probability vectors. The vectors express the probability that an observation belongs to one of five classes.
numObs = 10;
numClasses = 5;

prob = rand(numObs,numClasses);

tot = sum(prob,2);
prob = prob./tot
prob = 10×5

    0.2938    0.0568    0.2365    0.2546    0.1582
    0.3895    0.4174    0.0154    0.0137    0.1641
    0.0427    0.3217    0.2854    0.0931    0.2573
    0.2878    0.1529    0.2943    0.0145    0.2505
    0.2640    0.3341    0.2834    0.0405    0.0780
    0.0422    0.0614    0.3280    0.3564    0.2120
    0.1078    0.1632    0.2876    0.2689    0.1725
    0.1940    0.3249    0.1392    0.1125    0.2293
    0.2356    0.1949    0.1613    0.2338    0.1745
    0.3345    0.3326    0.0593    0.0119    0.2616
Define the set of five classes.
classes = ["Red","Yellow","Green","Blue","Purple"];
Decode the probabilities into the most probable classes by using the onehotdecode function. The probability vectors are encoded into the second dimension (each column corresponds to a unique class), so specify the dimension containing encoded probabilities as 2. Obtain the most probable classes as a string vector.
result = onehotdecode(prob,classes,2,"string")result = 10×1 string
"Red"
"Yellow"
"Yellow"
"Green"
"Yellow"
"Blue"
"Green"
"Yellow"
"Red"
"Red"
Decode predicted class scores into predicted labels.
Load the fisheriris data set. Create X as a numeric matrix that contains four measurements for 150 irises. Create S as a vector of categorical labels that contains the corresponding iris species.
load fisheriris
X = meas;
S = categorical(species);
One-hot encode the labels into probability vectors by using the onehotencode function. Encode the probability vectors into the second dimension.
Y = onehotencode(S,2);
Compute the fitted coefficients of a simple linear classifier.
B = X\Y
B = 4×3

    0.0834    0.2117   -0.1481
    0.2533   -0.3059    0.1412
   -0.2270    0.1888    0.0181
   -0.0635   -0.5749    0.5873
Predict the class scores from the fitted coefficients, and ensure that the scores are in the range [0,1].
scores = X*B;
scores = min(1,max(0,scores));
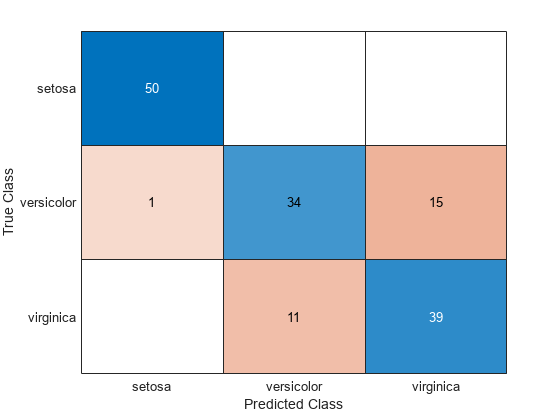
Decode the predicted class scores into predicted labels by using the onehotdecode function. Then, create a confusion chart to compare the true labels S with the predicted labels label.
label = onehotdecode(scores,categories(S),2);
confusionchart(S,label)
Input Arguments
Output Arguments
Version History
Introduced in R2021b