Save and Restore Operating Points for Stateflow Charts
An operating point is a snapshot of a Simulink® model during simulation. If your model contains a Stateflow® chart, the operating point includes information about:
Active states
Chart output data
Chart, state, and function local data
Persistent variables in MATLAB® functions and truth tables
You can save the state of a model at a certain time step as an operating point and then use that operating point as the initial state for a simulation. For example, suppose that your simulation starts with an initialization phase. If you save an operating point after the model completes the initialization phase, you can use the operating point as the initial state for your model and get the results of a continuous simulation without starting from time t = 0. For more information, see Use Operating Points to Specify Initial State of Simulation.
Save Operating Points
To save the final operating point of a Simulink model, enable the configuration parameters Final states (Simulink) and Save final operating
point (Simulink), optionally specify a variable for the operating point for the model,
and run the simulation. Then, access the operating point information for the Stateflow chart by calling the get (Simulink) function
and specifying the operating point for the model and the block path to the chart.
For example, suppose you want to save an operating point for the model
sf_car, which contains the chart shift_logic.
Open the model.
mdl = "sf_car";
openExample(mdl);
Set the model to save the final operating point. Then, run the simulation.
set_param(mdl,"SaveFinalState","on","SaveOperatingPoint","on");
sim(mdl);
If you do not specify a name for the operating point, the default name is
xFinal. To access the operating point information for this chart,
enter:
op = get(xFinal,"sf_car/shift_logic")op =
Block: "shift_logic" (handle) (active)
Path: sf_car/shift_logic
Contains:
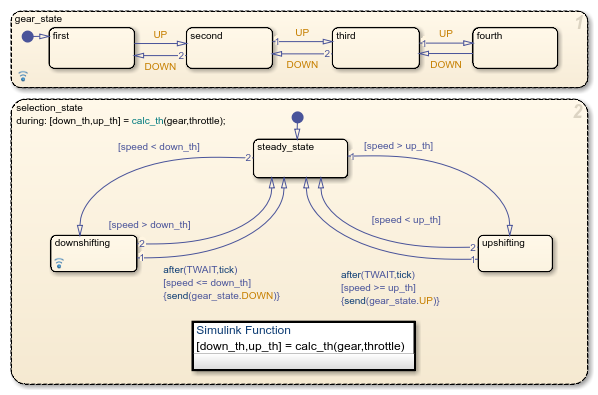
+ gear_state "State (AND)" (active)
+ selection_state "State (AND)" (active)
gear "State output data" gearType [1, 1]
down_th "Local data" double [1, 1]
up_th "Local data" double [1, 1]
datasetWrittenToVector "Data set written to vector" logical 4x1The operating point lists the states, boxes, functions, and data in the chart in hierarchical order. If name conflicts exist, the operating point appends underscores to the end of these names so that the objects have unique identifiers.
To access the operating point information for an object in the chart, use dot notation.
For example, to access the operating point information for the top-level state
gear_state, enter:
op.gear_state
ans =

State: "gear_state"    (handle)    (active)
  Path:     sf_car/shift_logic/gear_state

  Contains:

    + first          "State (OR)"
    + fourth         "State (OR)"
    + second         "State (OR)"
    + third          "State (OR)"         (active)
To access the operating point information for the chart output gear,
enter:
op.gear
ans =

     Description: 'State output data'
        DataType: 'gearType'
            Size: '[1, 1]'
           Range: [1×1 struct]
    InitialValue: []
           Value: third
            Root: [1×1 Stateflow.op.BlockOperatingPoint]
          Parent: [1×1 Stateflow.op.BlockOperatingPoint]
For more information about this example, see Model a Car with Automatic Transmission.
Note
Stateless flow charts have an empty operating point because they do not contain states or persistent data.
Copy Operating Points
To create a copy of the operating point for a Stateflow chart, call the clone function. For example, suppose that
you try to copy the operating point op by entering:
op1 = op;
op2 = clone(op);
In this case, op1 refers to the same operating point as
op, so modifying op1 also modifies
op. In contrast, op2 refers to a different
operating point that you can modify without modifying op.
Note
The clone function copies the operating point information for
the entire Stateflow chart. You cannot copy the operating point information for a state or data
object.
Modify Operating Point Values
To test the response of your Stateflow chart to different settings, you can modify an operating point by changing the values of the local, output, or persistent data, the states that are currently active, and the previous state activity recorded by history junctions during a simulation.
Modify Data Values
To modify the values of local, output, or persistent data in an operating point,
change the Value property of the data. For example, to change the down
throttle threshold in the operating point op, enter:
op.down_th.Value = 25;
When you modify data values:
You cannot change the data type or size.
Refer to elements of a vector or matrix by using one-based indexing delimited by parentheses and commas, even if your chart uses C as the action language.
New values for numeric data must be within the range that you specify in the Minimum and Maximum parameters. For more information, see Limit range.
For enumerated data types, you can choose only enumerated values from the type definition.
You cannot modify the values of persistent data in custom C code or external MATLAB code.
Modify Current State Activity
To change the states that are currently active in an operating point, call the
setActive function using a leaf state as
an argument. This function maintains state consistency by:
Exiting and entering the appropriate states
Resetting temporal counters for newly active states
Updating values of active state data
Enabling or disabling function-call subsystems and Simulink functions that bind to states
However, the chart does not perform exit actions for the
previously active states or entry actions for the newly active state.
Additionally, the state does not reinitialize any state-parented local data. If you want
these actions to occur, you must execute them separately. For example, if your state
actions assign values to data, you must assign the values explicitly as described in Modify Data Values.
Modify Previous State Activity
To change the previously active state recorded by a history junction, call the
setPrevActiveChild function
using the state that contains the history junction as an argument. The state must not be
active when you call this function.
Load Modified Operating Point Information
To load modified operating point information for a Stateflow chart into the operating point for a Simulink model, call the set (Simulink)
function. For example, if xFinal is the operating point for the model
sf_car and op contains the modified operating
point information for the chart shift_logic, you can save the modified
operating point xModified by entering:
xModified = set(xFinal,"sf_car/shift_logic",op);Note
The set function loads the operating point information for the
entire Stateflow chart. You cannot load the operating point information for a state or data
object.
Restore Operating Points
To use an operating point as the initial state for a simulation, set the configuration parameter Initial state (Simulink) and specify the variable name for the operating point for the model. When you simulate your model, the simulation starts at the time of the operating point. For more information, see Speed Up Simulation Workflows by Using Model Operating Points (Simulink).
Limitations on Operating Points
Continuous-Time Charts
Operating points for continuous-time charts are read-only. You can save an operating point for a continuous-time chart and use it as the initial state for a simulation. However, you cannot modify the state activity or any data values in the operating point. For more information on continuous-time charts, see Continuous-Time Modeling in Stateflow.
Charts That Use Edge Detection
Stateflow charts that use edge detection operators do not support operating points. If your model contains a chart that uses edge detection, attempting to save the final operating point results in a compile-time error. For more information on edge detection operators, see Detect Changes in Data and Expression Values.
See Also
Model Settings
- Initial state (Simulink) | Final states (Simulink) | Save final operating point (Simulink)
Objects
Stateflow.op.BlockOperatingPoint|Stateflow.op.OperatingPointContainer|Stateflow.op.OperatingPointData
Functions
setActive|setPrevActiveChild|clone|get(Simulink) |set(Simulink)