Model Bang-Bang Controller by Using a State Transition Table
This example shows how to use a state transition table to model a bang-bang controller that regulates the temperature of a boiler by activating the heating element when the temperature is too low, and deactivating the heating element when the temperature is too high. To prevent the heating element from rapidly switching on and off, the boiler requires a minimum warm-up period after each activation.
The controller has these design requirements:
The boiler temperature cannot exceed 25 degrees Celsius.
The boiler temperature cannot fall below 23 degrees Celsius.
Steady-state operation requires a warm-up period of 10 seconds.
When the alarm signal sounds, the boiler must shut down immediately.
When the all-clear signal sounds, the boiler can turn on again.
Open Model
In the sf_stt_boiler model, the State Transition Table block contains the logic for the bang-bang controller, and the Boiler Plant model subsystem models the operation of the boiler.
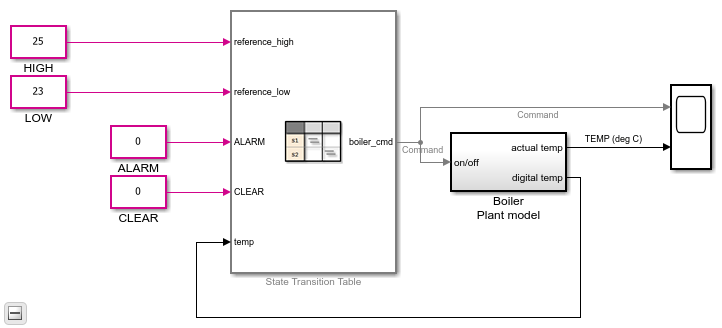
To view the table, double-click the State Transition Table block.
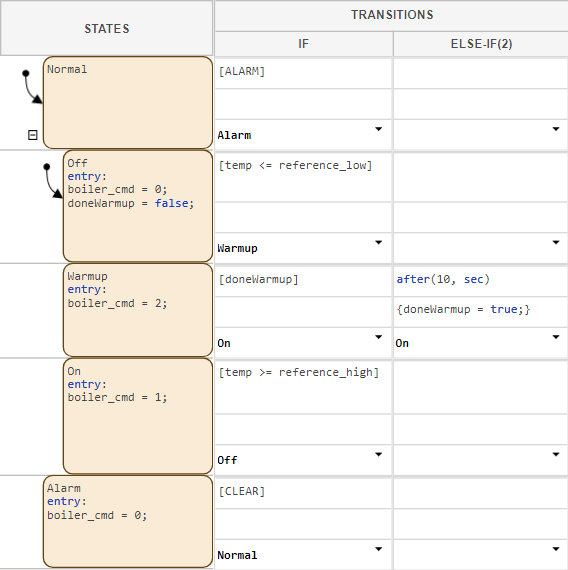
The state transition table represents the operating modes of the bang-bang controller as states. The controller has two primary operating modes:
Normal: Represents normal operation.Alarm: Represents the boiler shutting down in response to a fault.
Within the Normal operating mode, several sub-modes exist, indicated by an indented state.
Off: Represents the boiler turning off in response to excessive temperatures.Warmup: Represents the boiler warming up for at least 10 seconds after the heating element initially activates.On: Represents the boiler remaining on after the warm-up period.
Inspect Data
To manage the operation of the boiler, the state transition table inputs data from and outputs data to the other blocks in the model.
| Variable Name | Scope | Description |
|---|---|---|
reference_high | Input | An integer that represents the maximum temperature of the boiler. When an active boiler reaches this temperature, it turns off. |
reference_low | Input | An integer that represents the minimum temperature of the boiler. When an inactive boiler reaches this temperature, it turns on. |
doneWarmup | Local | A boolean that tracks whether the boiler has completed the warmup cycle. |
temp | Input | An integer that represents current temperature of the boiler. |
ALARM | Input | A boolean that signals whether the boiler should activate the
Alarm operating mode. |
CLEAR | Input | A boolean that signals whether the boiler should activate the
Normal operating mode. |
Inspect Transitions
The state transition table moves between operating modes when certain conditions are met. The state transition table defines this movement in the Transitions column, located to the right of the states.
For example, when the state Warmup is active, it tests the
condition row in the If column. If Warmup
has been active for at least ten seconds, Warmup deactivates and
On activates. For more information on how this condition row
works, see after.
Simulate Model
To observe the operation of the state transition table, in the Simulation tab, click Run.
The table transitions between child states Off,
Warmup, and Off as the boiler heats and
cools. Once every five minutes of simulation time, the alarm signal switches from
true to false, or false
to true. When the alarm activates, normal operation stops and the
table moves to the state Alarm. Once the alarm deactivates,
normal operation continues.