Model Rechargeable Battery System as Chart
Stateflow® charts use a graphical canvas to model the elements of a finite state machine. For more information about finite state machines, see Design Finite State Machines in Stateflow.
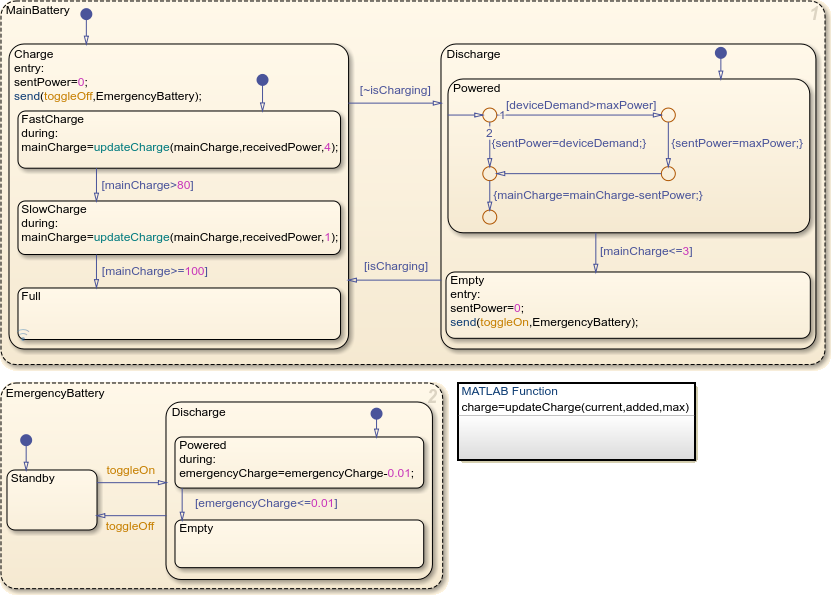
In this tutorial, you create a Stateflow chart that models a rechargeable battery system. The system has two batteries that contain multiple operating modes, share reusable components, and execute in parallel. The Stateflow chart exists as a block inside a Simulink® model, and inputs data from and outputs data to other blocks in the model.
Model Battery System
In the tutorial, you start with an empty chart, and in each topic, you add new functionality. The tutorial has these topics.
Create Stateflow Charts: Create a chart executes code and shares data.
Log, Verify, and Debug Charts: Use debugging tools to understand how a chart executes and fix unintended behavior.
Create Parent and Child Operating Modes: Create a hierarchy of nested states.
Connect Transitions by Using Junctions: Create multi-step and branching paths between states.
Execute States in Parallel: Activate multiple states in the same time step.
Reuse Logic in Charts: Use functions to create reusable components.