Code Instrumentation Profiler
In a code instrumentation profiler, code gets added into the generated code to record the start and stop times of each task executing on the processor. The recorded start and stop times of each task are sent to the development computer to be saved, processed, and displayed. The instantaneous state of each task gets inferred from the combined start and stop times and priorities of all the tasks within the process.
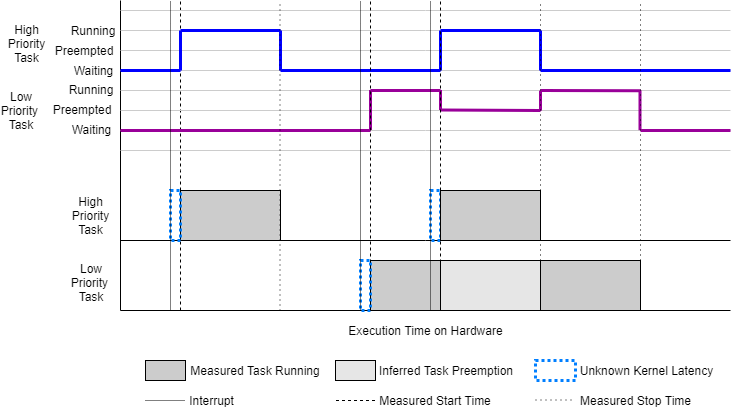
Consider a simple model with two tasks, one high- and low-priority executing on an embedded processor and measured by a code instrumentation profiler. This diagram shows the measurements made by the code instrumentation profiler and the inference on the individual task states resulting from these measurements.

Inspecting the diagram, it shows that the state of the low-priority task gets inferred from the higher-priority task's execution. Since only the start and end times of task execution get measured, some pertinent data can be lost, specifically kernel latency. As kernel latency precedes the start of the task, the actual time of the interrupt event is not directly observed and the start time of the task can assumed to be delayed from the actual time of the interrupt. Furthermore, when a task moves from the preempted to the running states, the kernel latency gets added into the interpreted execution time of the lower-priority task.
Code instrumentation profiling benefits from easy generation and deployment. On models deployed to processors with operating systems running a single process in a single tasking mode, task execution timing measurements be made with sufficient accuracy and precision. As only a minimal amount of code to record the start and stop times of the task get added to each task, the impact of the task execution timing by the code instrumentation profiler, inmost cases, can be considered negligible.
Limitations
Code instrumentation profiling provides lightweight measurement tooling of generated code. However, two limitations must be considered when measuring the task execution and duration times using the code instrumentation profiler. These limitations are as follows:
Cannot measure kernel latency or components of kernel latency. Kernel latency can generally be treated as a constant. As kernel latency impacts all task start up time with approximately equal effect, an estimate of the kernel latency could be deduced with comparisons to the task timings in simulation. For more information on kernel latency, see Kernel Latency
Cannot capture the effect of commands issued to the OS kernel from within the task using Custom Code blocks. The code instrumentation profiler records the start time, end time, and preemption of a task by other tasks. However, when the task makes a call to the OS kernel, the code instrumentation profiler does not record the change of control between the task and the kernel as a preemption. As kernel calls, without detailed knowledge of the timing, can be treated as non-deterministic, the measured task duration cannot be reliably measured using this type of profiler. For more information on task duration, see Task Duration.