Insert Event into Execution Profiling Stream
This example shows how to use the Log Event block to insert a user-defined event into the execution profiling event stream. For more information about execution profiling, see Execution Profiling for Real-Time Applications.
Create Target Object and Connect
Create a Target object for the default target computer and connect to the target computer. In the MATLAB® Command Window, type:
tg = slrealtime;
connect(tg);
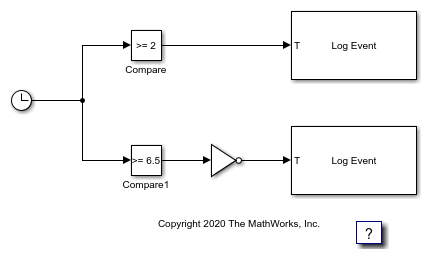
Open Model
To open the model, in the MATLAB Command Window, type:
open_system('slrt_ex_log_event');
model = 'slrt_ex_log_event';
open_system(model);
modelSTF = getSTFName(tg);
set_param(model,"SystemTargetFile",modelSTF);
Set Parameters to Measure Function Execution Times
Open the Configuration Parameters dialog box. Select Code Generation > Verification.
For Measure function execution times, select Detailed (all function call sites). The Measure task execution time check box is checked and locked. Click OK.
Or, in the MATLAB Command Window, type:
set_param(model,'CodeProfilingInstrumentation','Detailed');
set_param(model,'StopTime','30');
Build and Load Real-Time Application
Build the model and download to the target computer.
evalc('slbuild(model)');
load(tg,model);
Profile Execution
Start the tracer and then execute the real-time application.
startTracer(tg);
start(tg);
pause(20)
stopTracer(tg);
stop(tg);
Download Tracer Data
Retrieve the tracer data.
getTracerData(tg);
Close Model
bdclose(model);