Review Results from Analysis Report
Simulink Design Verifier Report Generation
After an analysis, Simulink® Design Verifier™ can generate an HTML report that contains detailed information about the analysis results.
The analysis report contains hyperlinks that allow you to:
Navigate to a specific part of the report
Navigate to the object in your Simulink model for which the analysis recorded results
You can also generate an additional PDF version of the Simulink Design Verifier report.
Create Analysis Reports
To create a detailed analysis report before or after the analysis, do one of the following:
Before the analysis, in the Configuration Parameters dialog box, on the Design Verifier > Report pane, select Generate report of the results. If you want to save an additional PDF version of the Simulink Design Verifier report, select Generate additional report in PDF format.
After the analysis, in the Simulink Design Verifier log window, you can choose HTML or PDF format and Generate detailed analysis report.
Front Matter
The report begins with two sections:
Title
The title section lists the following information:
Model or subsystem name Simulink Design Verifier analyzed
User name associated with the current MATLAB® session
Date and time that Simulink Design Verifier generated the report
Table of Contents
The table of contents follows the title section. Clicking items in the table of contents allows you to navigate quickly to particular chapters in the report.
Summary Chapter
The Summary chapter of the report lists the following information:
Name of the model
MATLAB release in which the analysis was performed
Checksum value that represents the state of the model analyzed
Analysis mode
Model Representation
Test generation target (applicable for test case generation analysis)
Analysis status
Preprocessing time
Analysis time
Status of objectives analyzed. This includes the percentage number for each status

Analysis Information Chapter
The Analysis Information chapter of the report includes the following sections:
Model Information
The Model Information section provides the following information about the current version of the model:
Path and file name of the model that Simulink Design Verifier analyzed
Model version
Date and time that the model was last saved
Name of the person who last saved the model
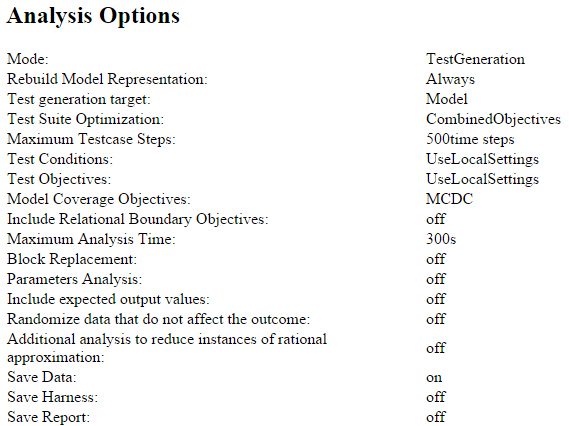
Analysis Options
The Analysis Options section provides information about the Simulink Design Verifier analysis settings.
The Analysis Options section lists the parameters that affected the Simulink Design Verifier analysis. If you enabled coverage filtering, the name of the filter file is included in this section.
Note
For more information about these parameters, see Configure Analysis Options for Model.
Unsupported Blocks
If your model includes unsupported blocks, by default, automatic stubbing is enabled to allow the analysis to proceed. With automatic stubbing enabled, the software considers only the interface of the unsupported blocks, not their actual behavior. This technique allows the software to complete the analysis. However, the analysis may achieve only partial results if any of the unsupported model blocks affect the simulation outcome.
The Unsupported Blocks section appears only if the analysis stubbed unsupported blocks; it lists the unsupported blocks in a table, with a hyperlink to each block in the model.

For more information about automatic stubbing, see Handle Model Complexities with Automatic Stubbing.
User Artifacts
The User Artifacts section provides information about test data and coverage data in the Simulink Design Verifier analysis.
Parameter and Variant Constraints
The Parameter Constraints subsection in the Parameter and Variant Constraints section provides information about test conditions applied by Simulink Design Verifier during model analysis.

You can navigate to the constraint in your model by clicking the hyperlink in the Constraints table. The software highlights the corresponding Test Condition block in your model window and opens a new window showing the block in detail.
You can view the workspace information about the constraint from Source and SourceType column in the Constraints table. These columns contain information on whether the parameter is from the model workspace, base workspace, or data dictionary.

Block Replacements Summary
The Block Replacements Summary provides an overview of the block replacements that Simulink Design Verifier executed. It appears only if Simulink Design Verifier replaced blocks in a model.
Each row of the table corresponds to a particular block replacement rule that Simulink Design Verifier applied to the model. The table lists the following:
Name of the file that contains the block replacement rule and the value of the
BlockTypeparameter the rule specifiesDescription of the rule that the
MaskDescriptionparameter of the replacement block specifiesNames of blocks that Simulink Design Verifier replaced in the model
To locate a particular block replacement in your model, click on the name for that replacement in the Replaced Blocks column of the table; the software highlights the affected block in your model window and opens a new window that displays the block in detail.

Approximations
Each row of the Approximations table describes a specific type of approximation that Simulink Design Verifier used during its analysis of the model.

Note
Review the analysis results carefully when the software uses approximations. In rare cases, an approximation may result in test cases that fail to achieve test objectives or counterexamples that fail to falsify proof objectives. For example, a floating-point round-off error might prevent a signal from exceeding a designated threshold value.
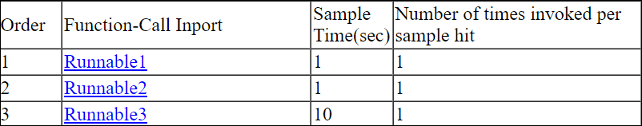
Analysis Harness Information
The Analysis Harness Information section provides an overview of the analysis harness generated by Simulink Design Verifier used to analyze the model. The Analysis Harness Information section shows these sub-sections based on whether the model is an export-function model or a model that contains Function Caller blocks without corresponding Simulink functions.
Schedule for Export Function analysis. Simulink
Design Verifier assumes an analysis harness for invoking Export
Functions during analysis. For example, this table shows the analysis
harness for the model sldvExportFunction_autosar_multirunnables:
Stubbed Simulink Functions for Analysis. This table in the Stubbed Simulink Functions for Analysis lists the function prototypes that correspond to the stubbed Simulink functions which are stubbed in the analysis harness:
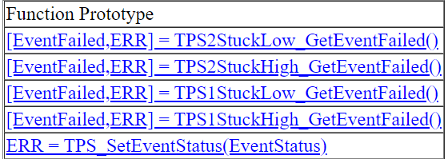
Note
Simulink Design Verifier assumes the outputs of stubbed Simulink functions do not change when the function is invoked multiple times during a single time step.
Derived Ranges Chapter
In a design error detection analysis, the analysis calculates the derived ranges of the signal values for the Outports for each block in the model. This information can help you identify the source of data overflow or division-by-zero errors.
The table in the Derived Ranges chapter of the analysis report lists these bounds.

If an Observer Reference block is used in the design error detection analysis, then this section will show the observer information in a Observer Model (s) subsection and design model information in Design Model subsection.
The table in the Design Model subsection shows the list of each derived range in the
sldvdemo_debounce_validprop example model.

The Observer model(s) section will not show derived ranges reported as the observers are ignored for design error detection analysis.
Objectives Status Chapter
This section of the report provides information about all the objectives in a model, including the type of the objective, the model item that corresponds to the type, objective description, and analysis time. The Analysis Time in Objectives Status Chapters is the time at which the objective was decided.
Test Objectives Status
Reports whether test cases satisfy, cannot satisfy, or cannot decide test objectives. For more information, see Test Generation Objective Statuses.
Design Error Detection Objectives Status
Reports whether the analysis finds design errors, dead logic, no errors, or remains inconclusive. For more information, see Design Error Detection Objective Statuses
Proof Objectives Status
Reports whether the analysis proves a property, finds a violation, or cannot decide. For more information, see Property Proving Objective Statuses
Common Objectives Status
Reports result as inconclusive. For more information, see Common Objectives Status.
The software identifies the presence of approximations and reports them at the level of each objective status. For more information, see Understanding Result Approximations. This table summarizes the objective status for Simulink Design Verifier analysis modes.
Model Items Chapter
The Model Items chapter of the report includes a table for each object in the model that defines coverage objectives. The table for a particular object lists all of the associated objectives, the objective types, objective descriptions, and the status of each objective at the end of the analysis.
The table for an individual object in the model looks similar to this one for the
Discrete-Time Integrator in the PI Controller subsystem of the sldvdemo_cruise_control example model.
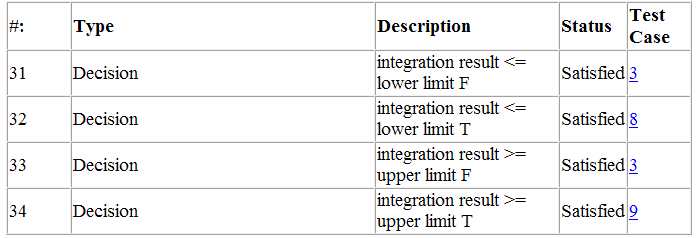
To highlight a given object in your model, click View at the upper-left corner of the table; the software opens a new window that displays the object in detail. To view the details of the test case that was applied to a specific objective, click the test case number in the last column of the table.
If an Observer Reference block is used in the property-proving analysis, then each model item section will show the observer information in Observer Model(s) subsection an design model information in Design Model subsection. These subsections will be empty if no test objective found in the model.
The table shows one of the test objectives for the design model in the sldvdemo_debounce_testobjblks example model.
![]()
The table shows one of the test objectives for the observer model in the sldvdemo_debounce_testobjblks example model.
![]()
Design Errors Chapter
If you perform design error detection analysis and the analysis detects design errors in the model, the report includes a Design Errors chapter. This chapter summarizes the design errors that the analysis falsified:
Table of Contents
The Design Errors chapter contains a table of contents. Each item in the table of contents is a hyperlink to results about a specific design error.
Summary
The Summary section lists:
The model item
The type of design error that was detected (overflow or division by zero)
The status of the analysis (Falsified or Proven Valid)
In the following example, the software analyzed the sldvdemo_debounce_falseprop model to detect design errors. The analysis
detected an overflow error in the Sum block in the Verification Subsystem
named Verify True Output.

Test Case
The Test Case section lists the time step and corresponding time at which the test
case falsified the design error objective. The Inport block
raw had a value of 255, which caused the overflow
error.

Test Cases Chapter
If you run a test generation analysis, the report includes a Test Cases chapter. This chapter includes sections that summarize the test cases the analysis generated:
Table of Contents
The Test Cases chapter contains a table of contents. Each item in the table of contents is a hyperlink to information about a specific test case.
Summary
The Summary section lists:
Length of the signals that comprise the test case
Total number of test objectives that the test case achieves

Objectives
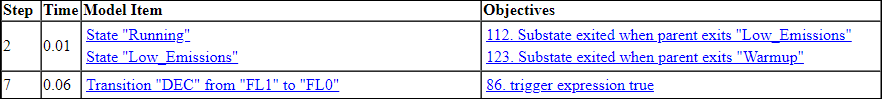
The Objectives section lists:
The time step at which the test case achieves that objective.
The time at which the test case achieves that objective.
A link to the model item associated with that objective. Clicking the link highlights the model item in the Simulink Editor.
The objective that was achieved with a link to navigate between the Test Objectives Status and Test Cases chapters.
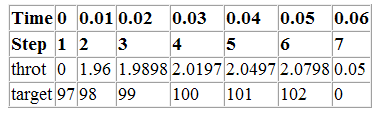
Generated Input Data
For each input signal associated with the model item, the Generated Input Data section lists the time step and corresponding time at which the test case achieves particular test objectives. If the signal value does not change over those time steps, the table lists the time step and time as ranges.

Note
The Generated Input Data table displays a dash (–) instead of a number as a signal value when the value of the signal at that time step does not affect the test objective. The table does not include the entire signal if all values of a signal are having no impact. In the harness model, the Inputs block represents these values with zeros unless you enable the Randomize data that does not affect outcome parameter (see Randomize data that do not affect the outcome).
Expected Output
If you select the Include expected output values on the Design Verifier > Results pane of the Configuration Parameters dialog box, the report includes the Expected Output section for each test case. For each output signal associated with the model item, this table lists the expected output value at each time step.
Long Test Cases
If you set the Test suite optimization option to
LongTestcases, the Test Cases chapter in the report includes
fewer sections about longer test cases.

Properties Chapter
If you run a property-proving analysis, the report includes a Properties chapter. This chapter includes sections that summarize the proof objectives and any counterexamples the software generated:
Table of Contents
The Properties chapter contains a table of contents. Each item in the table of contents is a hyperlink to information about a specific property that was falsified.
If an Observer Reference block is used in the property-proving analysis, then each properties chapter will show the observer information in Observer Model(s) subsection an design model information in Design Model subsection. It will be empty when there are no properties in the model.
The table shows one of the properties for the observer model in the sldvdemo_debounce_validprop example model.

Summary
The Summary section lists:
The model item that the software analyzed
The type of property that was evaluated
The status of the analysis
In the following example, the software analyzed the sldvdemo_cruise_control_verification model for property proving. The analysis
proved that the input to the Assertion block named BrakeAssertion was
nonzero.

Counterexample
The Counterexample section lists the time step and corresponding time at which the counterexample falsified the property. This section also lists the values of the signals at that time step.
