Collect Coverage for Multiple Simulations by Using Design Studies
This example shows how to collect coverage when running multiple simulations. To learn more about running multiple simulations, see Run Multiple Simulations.
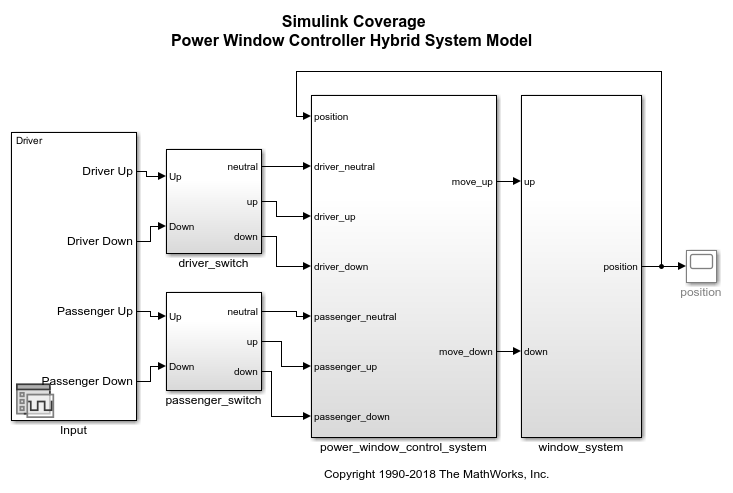
The slvnvdemo_powerwindow_parsim model contains a power window controller and a low-order plant model. A Stateflow® chart implements the controller.
Load the Design Study
Design studies allow you to run a series of simulations where each simulation changes one parameter at a time. You can collect coverage on the simulations to test different sets of model inputs without manually running each simulation. For more information about creating design studies, see Configure and Run Simulations with Multiple Simulations Panel.
To open the Multiple Simulations pane, on the Simulation tab, under Prepare, click Multiple Simulations.
To load the design study file, click the Load file containing design studies icon at the top of the Multiple Simulations pane. In the Select File to Open window, select slvnvdemo_powerwindow_multisim.mldatx.
This file contains two design studies:
The Driver Scenario design study contains two simulations. In both simulations, the Signal Editor block Input parameter Active Scenario is set to Driver. In the first simulation, the Active Signal parameter is set to Driver Up, and in the second simulation the parameter is set to Driver Down. These settings simulate the driver-side power window receiving input to raise and lower the window.
The Passenger Scenario design study contains two simulations. In both simulations, the Signal Editor block Input parameter Active Scenario is set to Passenger. In the first simulation, the Active Signal parameter is set to Passenger Up, and in the second simulation the parameter is set to Passenger Down. These settings simulate the passenger-side power window receiving input to raise and lower the window.
Enable Coverage Analysis
Next, enable coverage for the model. On the Modeling tab, click Model Settings. In the left pane, click Coverage and then select Enable coverage analysis. Click OK.
Run Simulations and Review Coverage Results
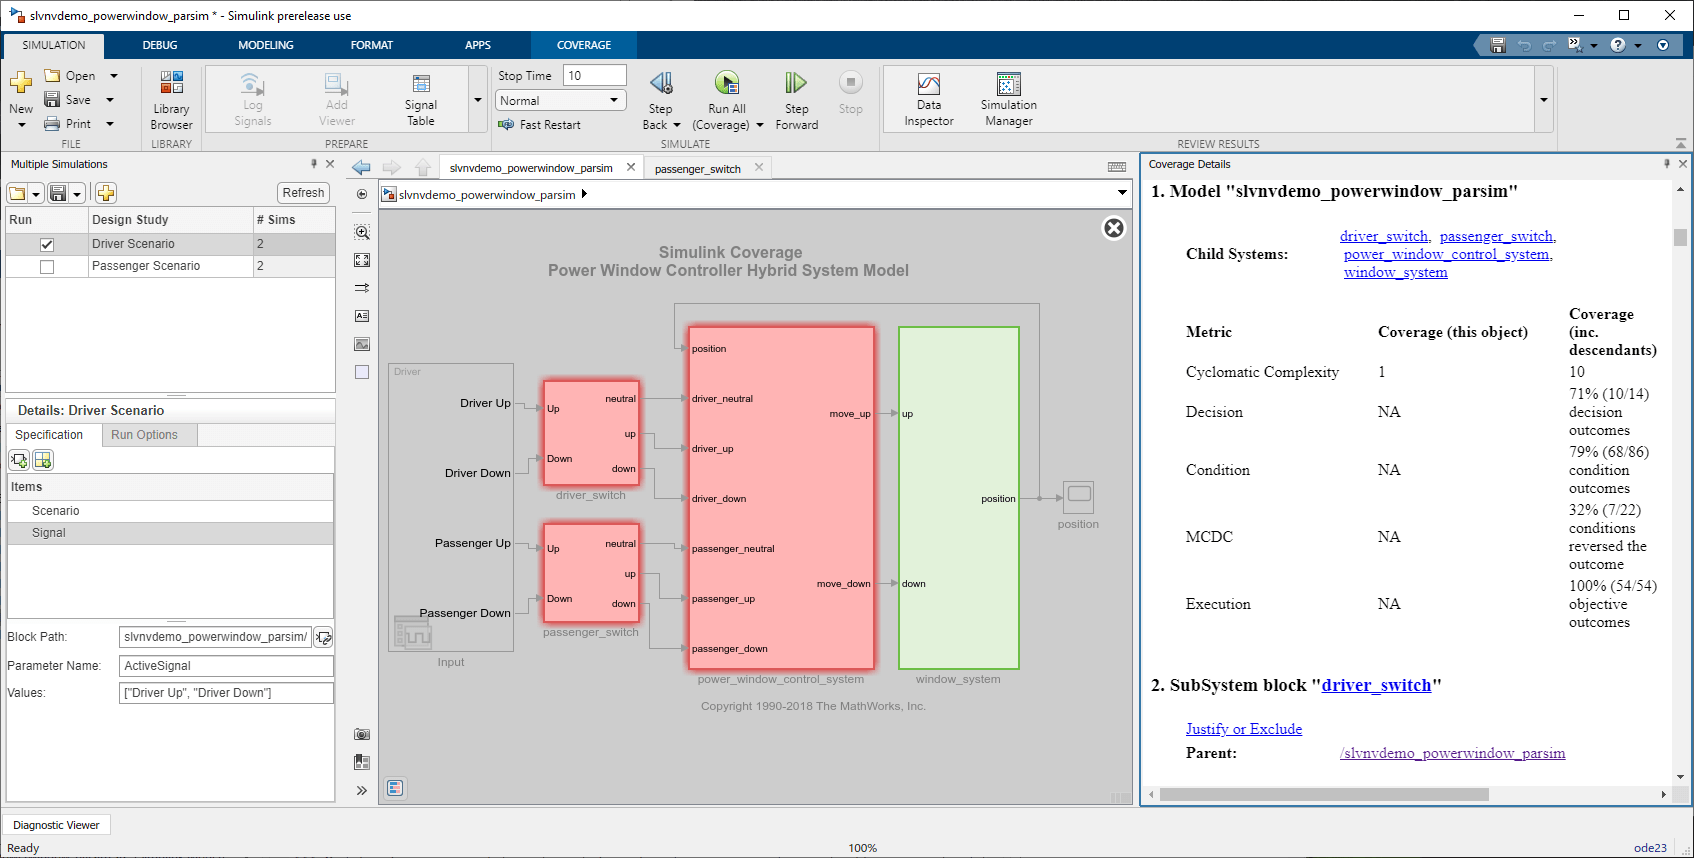
In the Multiple Simulations pane, select Driver Scenario. On the Apps tab, select Coverage Analyzer. In the Coverage tab, click Analyze Coverage > Run All (Coverage)
After the simulations complete, the Coverage Details pane opens and displays the aggregated coverage results for the two simulations in the Driver Scenario.
The coverage results for all of the simulations are populated into the Coverage Results Explorer. To open the Coverage Results Explorer, on the Coverage tab, click Results Explorer.
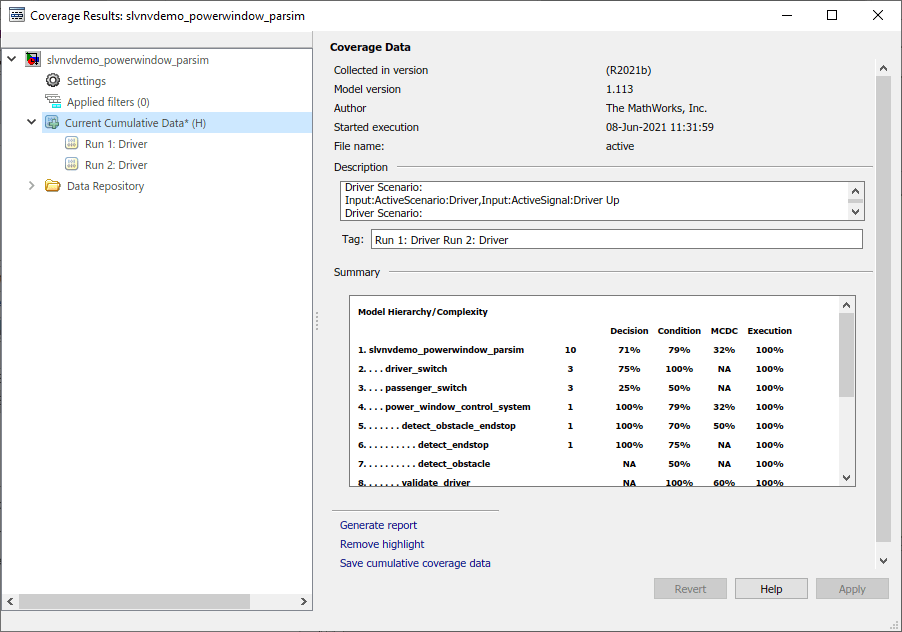
In the left pane of the Coverage Results Explorer, you can see the two simulations for the Driver Scenario design study and the current cumulative results. In the left pane, click Current Cumulative Data. In the Coverage Data pane, the description lists the design study name and a list of the block and parameter names specified in the design study. The Tag field lists the scenario specified for each run.
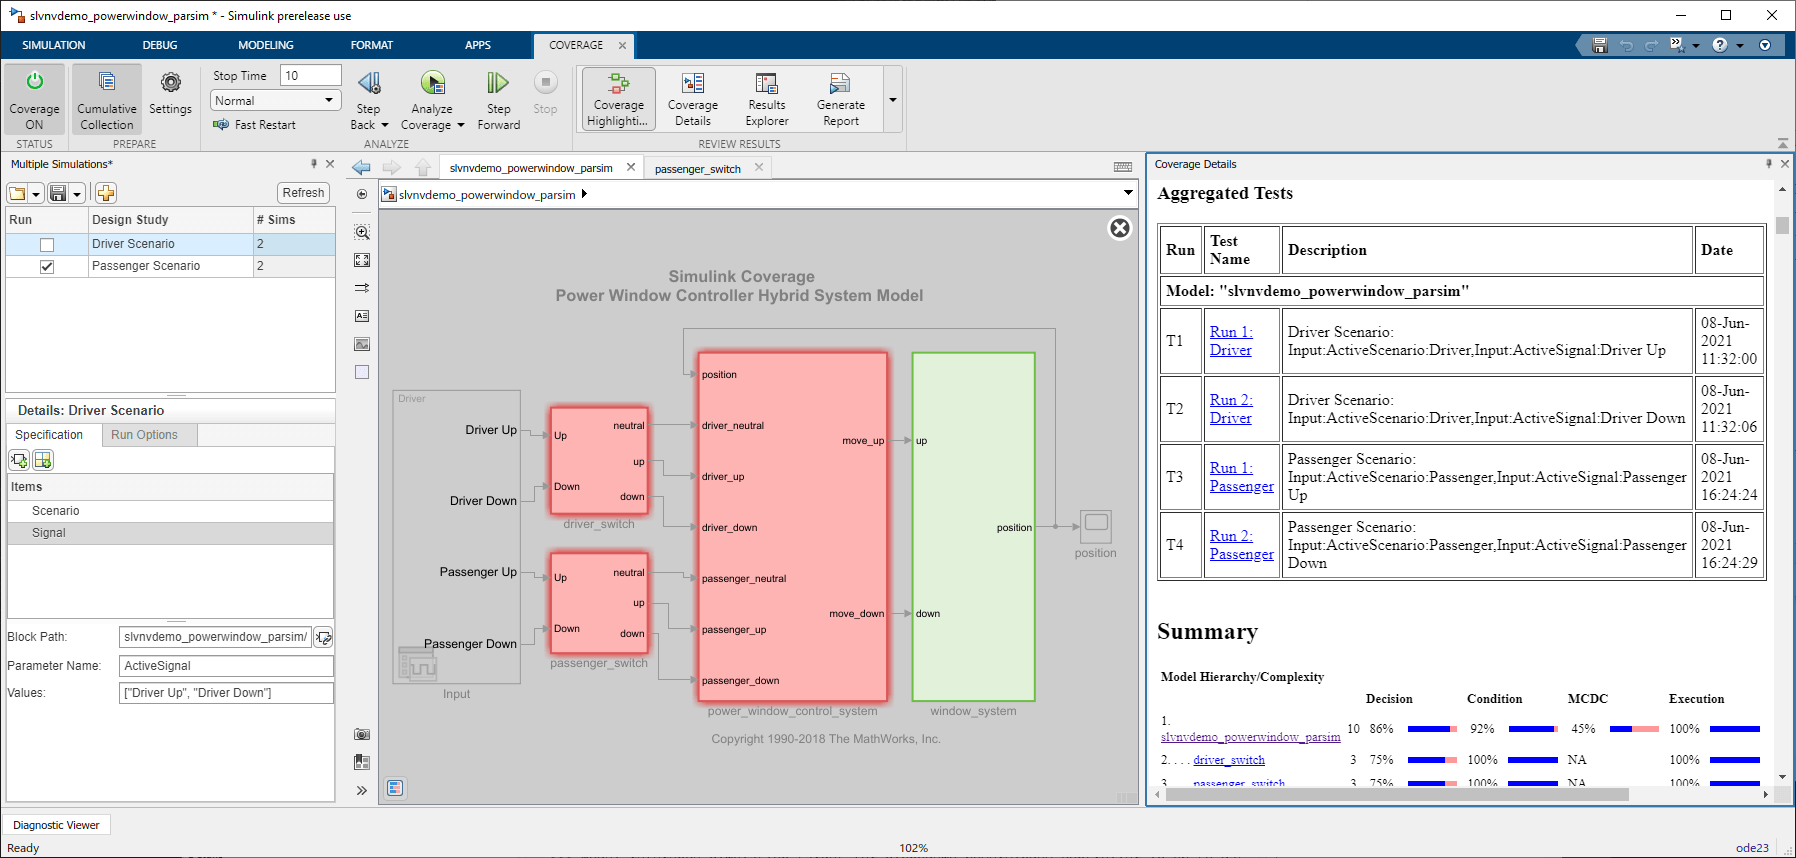
In the Simulink® window, in the Multiple Simulations pane, select Passenger Scenario. This action automatically clears the Driver Scenario design study because you can only select one design study at a time. On the Coverage tab, click Analyze Coverage > Run All (Coverage).
The Coverage Details pane updates with aggregated data from the two additional simulations in the Passenger Scenario design study. Scroll to the Aggregated Tests section to see four simulations: two from the Driver Scenario design study, and two from the Passenger Scenario design study.
In the Coverage Results Explorer, click Current Cumulative Data to see that the additional simulations improved the coverage results.

Additionally, you can click each run to see that the aggregated coverage data displays more complete coverage than either of the individual runs. The different coverage results indicate that the different simulations satisfied different coverage outcomes.
To generate a standalone report for these results, in the Simulink® window, on the Coverage tab, click Generate Report. Alternatively, in the Coverage Results Explorer, in the left pane, click Current Cumulative Data and then click Generate report.