Create Project to Use Model Design and Model Testing Dashboards
This example shows how to create a project to use the Model Design and Model Testing Dashboards to analyze your model. The project folder, and referenced project folders, define the scope of the artifacts that the dashboard metrics analyze.
Model Design Dashboard — Use this dashboard to collect model metric data and assess the quality of the models in your project.
Model Testing Dashboard — Use this dashboard to assess the verification status and quality of your models and generated code.
Create Project
Create a project that organizes your model and dependent files. To create a project directly from a Simulink® or System Composer™ model, on the Simulation tab, select New > Project > New Project from this Model and click OK. Simulink automatically identifies required files and places the model and files inside the project folder. For more information, see Create Project from Model.

Projects allow you to manage your files and settings, but you do not need to
explicitly add files to the project, use source control, or add specific project labels
to use your project with the dashboards. When you create a project, MATLAB® creates a .prj file and a
resources/project folder structure that stores information about
your project and files. The dashboard uses the project information and structure to
identify and analyze the artifacts that are relevant to your design. By default, the
project uses multiple XML files to store the definition of your project. For information
on the project definition files and information on how to change the project definition
file management, see Project Definition Files.
Open Dashboard
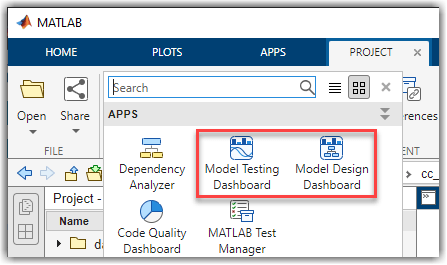
To open a dashboard, open your project and, on the Project tab, in the Tools section, click either Model Testing Dashboard or Model Design Dashboard.
For information on the different types of dashboards, see Analyze Your Project with Dashboards.
Enable Artifact Tracing
When you open a dashboard on a project for the first time, the Enable Artifact Tracing dialog box opens and prompts you to enable artifact tracing for the project. Artifact tracing allows the dashboard to create a digital thread that monitors the project for changes and identify if the changes invalidate the metric results. For information on how the dashboards monitor files and detect outdated metric results, see Monitor Artifact Traceability and Detect Outdated Results with Digital Thread.
Click Enable and Continue to create a digital thread for the project. Note that clicking Enable and Continue is equivalent to selecting the Track tool outputs setting in the Digital Thread Settings dialog box.
After you click Enable and Continue, the dashboard:
Updates the digital thread settings to turn on the Track tool outputs setting.
Performs the first-time setup and initial project analysis to identify software units and components, trace project artifacts to those units and components, and analyze the traceability relationships between artifacts.
Collects metric results for the currently selected software unit or component.
Creates a
derivedfolder that contains two files:artifacts.dmr— Contains a cached version of project analysis data that the digital thread collects when analyzing the project.resultservice.dmr— Stores metric results.
After the first-time setup and initial project analysis finishes, you can use the dashboard to explore the metric results. For more information, see Analyze Your Project with Dashboards.
Optional Project and Dashboard Settings
To use a dashboard, you only need to create and open a project. But you can also, optionally, modify your project settings and dashboard settings to reconfigure what you see in the dashboard. For general information on how to customize and use projects, see Set Up Project.
Specify Different Software Units and Components
The Project panel displays artifacts from the current project that are compatible with the currently selected dashboard. For example, you can open the Model Testing Dashboard for a unit in your project and you can open the Model Maintainability Dashboard for a unit or component in your project.
A unit is a functional entity in your software architecture that you can execute and test independently or as part of larger system tests. A component is an entity that integrates multiple testable units together.
By default, the dashboard analyzes all models inside your project folder and considers:
Simulink models as units.
System Composer architecture models as components.
You can use a trace view to see the units and components in your project. For more information, see Explore Traceability Information Using Trace Views.
If you want to specify different models in your software architecture as units and components, you can add project labels to the entities and configure the dashboard options to recognize the labels. For more information, see Categorize Models in Hierarchy as Components or Units.
Project File Management and Source Control
By default, projects use multiple project files, but you can change the project definition file management to use a single project file instead. Using a single project file is faster, but is not recommended for source control. For more information, see Project Definition Files.
You do not need to use source control to use the dashboard, but if you choose to use your project with a source control system, make sure to:
Treat the project file (
.prj) and theresources/projectfolder as source artifacts along with your models and other required files.Treat the
derivedfolder,artifacts.dmrfile, andresultservice.dmras derived artifacts. You should not check the derived artifacts into source control. For more information, see Work with Derived Files in Projects Under Source Control.
For general information on how projects work with source control, see Use Source Control with MATLAB Projects.