View Streaming Data in the Simulation Data Inspector
During simulation, many types of logged data, such as data logged in
Dataset format, automatically stream to the Simulation Data Inspector,
allowing you to monitor and analyze your data in real-time. For more information about which
types of data are streamed to the Simulation Data Inspector during simulation, see View Simulation Data in Simulation Data Inspector.
In R2025a: Live streaming is not supported for XY plots in external mode.
When streaming data to the Simulation Data Inspector, you can control how incoming data is displayed by specifying the behavior of the time axis. You can set a time span, choose how plot updates are drawn, and freeze the display to better view and analyze your streaming data. These options are helpful when working with real-time models or infinite simulation times or when you use simulation pacing to interact with the system. You can also use triggers to control when to draw the plot of a streaming signal in the Simulation Data Inspector. For more information, see Control Display of Streaming Data Using Triggers.
Note
To live stream data to an XY visualization, data must be plotted as a scatter plot. To
change the line style to only data markers, click Visualization Settings
![]() and in the Axes section, select
Markers and clear Line. Trend lines are not
supported while live streaming XY data.
and in the Axes section, select
Markers and clear Line. Trend lines are not
supported while live streaming XY data.
This example shows you how to control the time axis, display scaling, and display offset to better visualize your streaming data.
Open and Simulate the Model
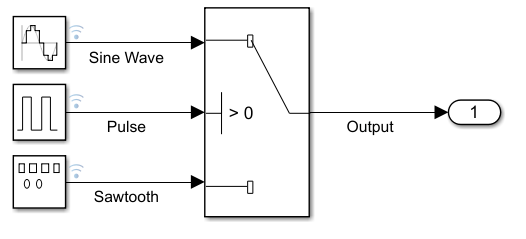
This model generates four logged signals: Sine Wave, Pulse, Sawtooth and Output. The Switch block is configured to allow the sine signal to pass through when the output of the Pulse Generator block is greater than zero. When the output of the Pulse Generator block is less than or equal to zero, the Switch block allows the sawtooth signal to pass through.
The model uses simulation pacing to slow down the simulation, which allows you to interact with the system. For more information, see Simulation Pacing Options.
Click Run to start a simulation.
When the simulation has finished, click Data Inspector to open the Simulation Data Inspector.
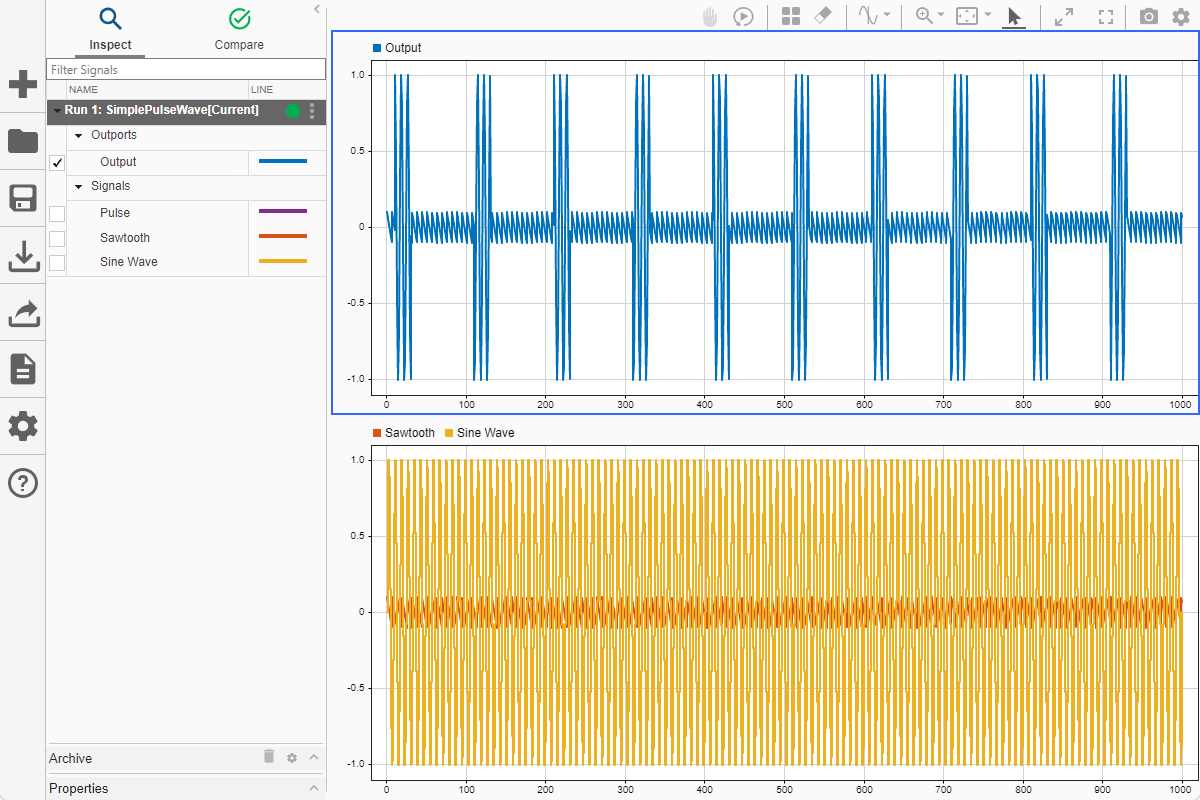
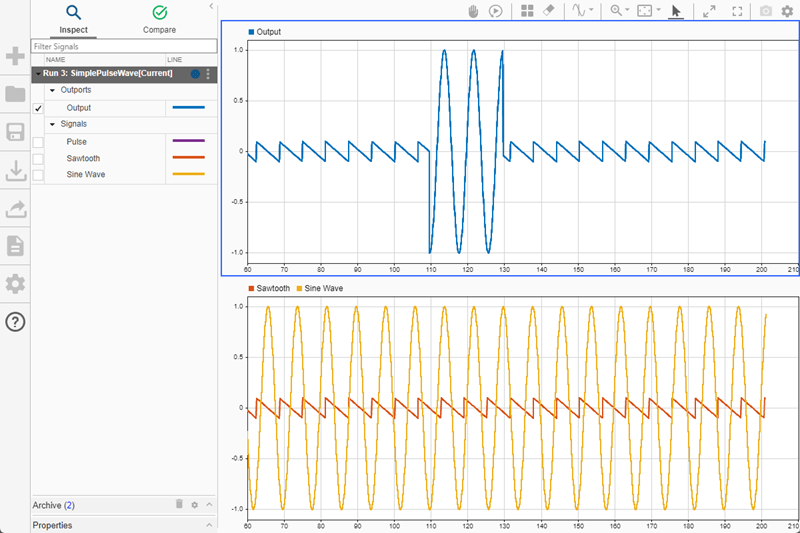
Change the plot layout to
2x1.Plot the
Outputsignal in the upper subplot.Plot the
SawtoothandSine Wavesignals in the lower subplot.
By default, the Simulation Data Inspector groups signals by domain. The Signals grouping contains all signals marked for signal logging: the output of the Pulse Generator block, the Signal Generator block, and the Sine Wave block. The Outports grouping contains the logged model output from the Switch block. When you plot a signal after the simulation completes, the Simulation Data Inspector fits the view to display all the signal data.
Change Time Span
If the simulation time is finite, the Time span can be set to
auto. When Time span is set to
auto, the t-axis spans the full simulation time.
However, when you view the entire simulation at once, the characteristics of the
Sine
          Wave
and Sawtooth signals are hard to see. You
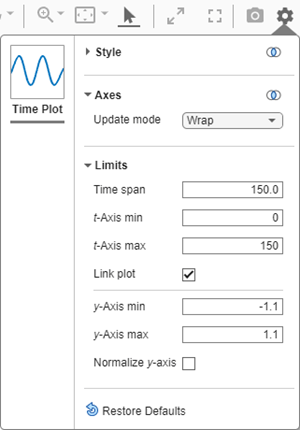
can view a portion of each signal by setting the Time span. Before
beginning the simulation, you can change the size of the visible time interval by changing
the Time span value. Click Visualization Settings
![]() . Then, in Limits > Time span, enter a value. When you change the minimum or maximum time axis limit during
live streaming, the time span remains fixed. When you change the time span during live
streaming, the minimum time axis limit remains the same and the maximum time axis limit
adjusts such that t-Axis max = t-Axis
min + Time span.
. Then, in Limits > Time span, enter a value. When you change the minimum or maximum time axis limit during
live streaming, the time span remains fixed. When you change the time span during live
streaming, the minimum time axis limit remains the same and the maximum time axis limit
adjusts such that t-Axis max = t-Axis
min + Time span.
For example, set Time span to 150. Because the
plots are linked, the t-axis has limits 0 to
150 at the start of the simulation for both subplots. When
Link plot is selected, any changes made in Visualization Settings
apply to all linked subplots. Subplots are linked by default. To unlink a subplot, select
the subplot. Then, in the Visualization Settings, clear Link
plot.
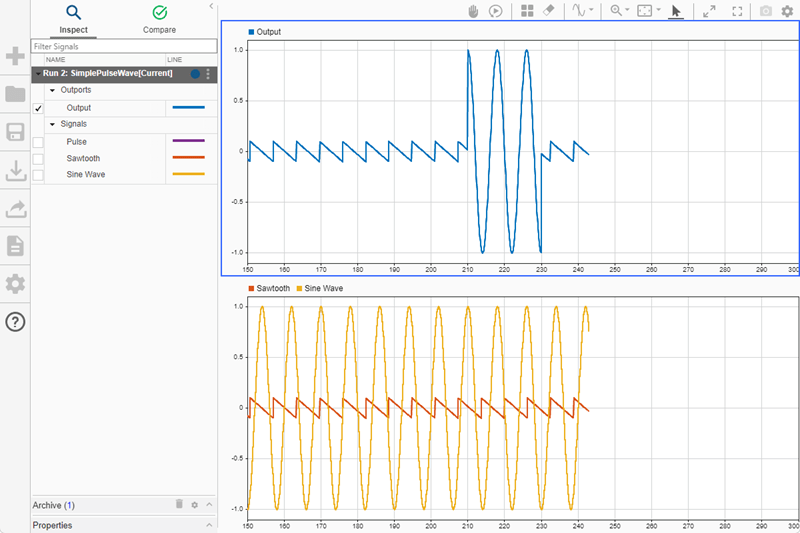
With the Time span set to 150, click
Run to start the simulation. When the simulation starts, the span
from 0 to 150 is visible on the
t-axis. After reaching 150, the
t-axis shifts to show 150 to 300.
Control Plot Update Behavior
You can change the way the Simulation Data Inspector updates subplots while streaming a
signal. Click Visualization Settings ![]() . Then, you can set Axes > Update mode to
. Then, you can set Axes > Update mode to Wrap or Scroll. By
default, the display updates by wrapping the plot.
In Wrap mode, the Simulation Data Inspector shows streaming data
until it reaches the maximum t-axis limit. When the data reaches this
limit, the minimum and maximum t-axis limits are increased by the
Time span value.
Set Update mode to Scroll. Start a new
simulation. In scroll mode, old data is moved out of view on the left as new data is plotted
on the right. In this mode, instead of jumping by 150,
t-axis scrolls with the streaming signal data.
Hold Display
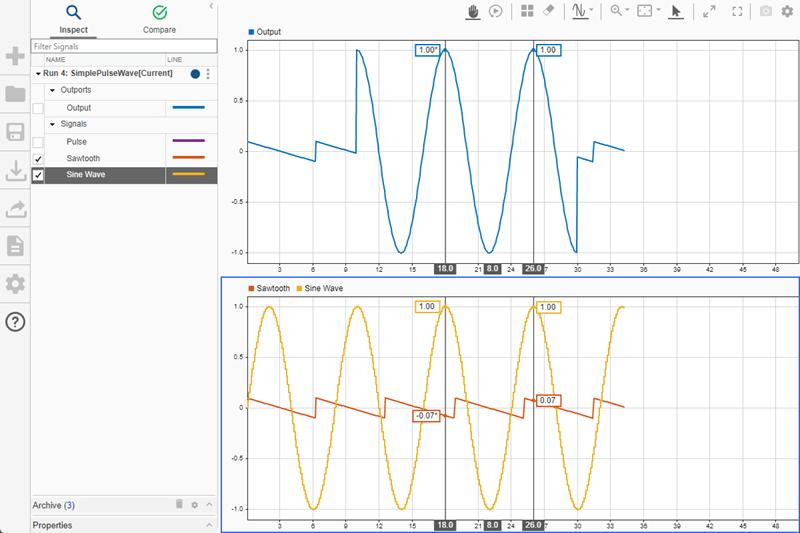
When you want the Simulation Data Inspector to pause the drawing of a streaming signal, you can hold the display. Holding the display lets you inspect your signal while the simulation is running. For example, suppose you want to measure the period of the sine wave while data is streaming. You can hold the display and use cursors to find the difference between two peaks.
To improve signal visibility, set Time span to
50.Start the simulation.
Click Hold
 to prevent the Simulation Data Inspector from
continuing to draw the streaming signals.
to prevent the Simulation Data Inspector from
continuing to draw the streaming signals.Before R2023b: Click Freeze display
 to prevent wrapping or scrolling of the display.
Click Show/hide data cursors
 . Then, select Two Cursors.
Drag the cursors to measure the difference between two peaks in the
OutputorSine Wavesignal.
When you finish measuring, click Resume ![]() to return your view to the current simulation time. If the
simulation ends while the display is held, the display jumps to the end.
to return your view to the current simulation time. If the
simulation ends while the display is held, the display jumps to the end.
Note
The simulation continues to run even through it is not drawn in the Simulation Data Inspector while the display is held. To pause the simulation, click Pause in the model.
Control Display Scaling and Display Offset
You can vertically scale and shift the display of individual signals from the Properties pane of the Simulation Data Inspector.
Use the Display Scaling property to vertically scale the appearance of a plotted signal. The Simulation Data Inspector plots the signal values multiplied by the scaling value. By default, Display Scaling is
1.Use the Display Offset property to vertically shift the appearance of a plotted signal. The Simulation Data Inspector plots the summation of the offset value added to the signal values. By default, Display Offset is
0.
Note
Changing the value of Display Scaling or Display Offset affects how the Simulation Data Inspector displays a signal. Signal values are unchanged.
For example, you can change the scaling and offset values for Sine
Wave and Sawtooth such that both signals are displayed
between y values of 0 and 1.
Select the signal
Sawtooth. Then, in the Properties pane, set Display Scaling to5and Display Offset to0.5.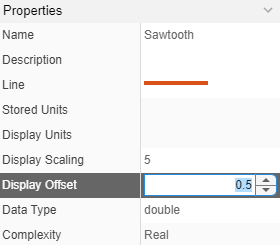
Select the signal
Sine Wave. Then, in the Properties pane, set Display Scaling to0.5and Display Offset to0.5.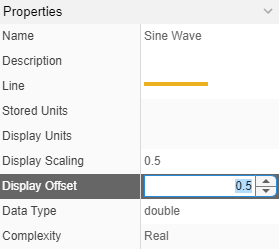
Select Fit to View in Y
 to adjust the view.
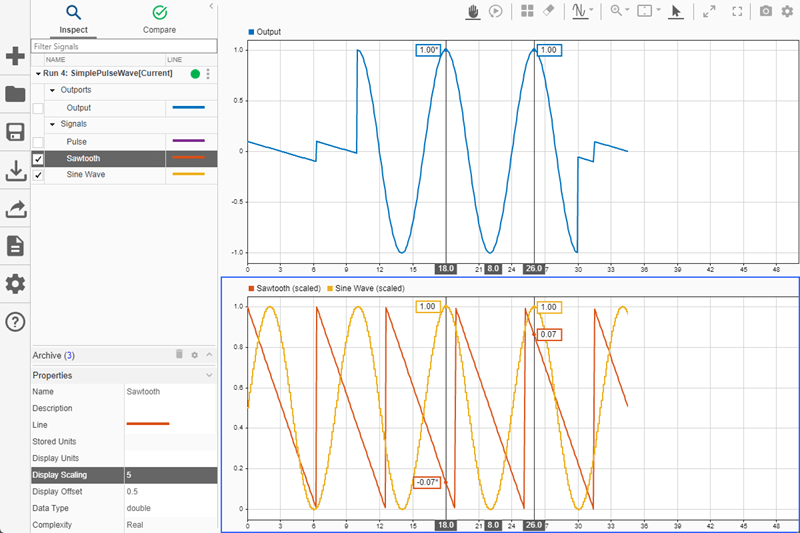
Notice that the cursors display the original signal values. When you set Display Scaling or Display Offset to values other than the defaults, you change the appearance of the plot. However, cursors display the data value of the signal, which remains unchanged.