Dashboard Scope
Trace signals on scope display during simulation
Libraries:
Simulink /
Dashboard
Description
The Dashboard Scope block plots connected signals during simulation on a scope display. You can use the Dashboard Scope block with other dashboard blocks to build an interactive dashboard of controls and indicators for your model. Signals connected to the Dashboard Scope block log to the Simulation Data Inspector for analysis during or after simulation. The Dashboard Scope block can display signals of any data type that Simulink® supports, including enumerated data types, and up to eight signals from an array or bus.
Connect Dashboard Blocks
Dashboard blocks do not use ports to connect to model elements. To connect a dashboard block,
use connect mode. To enter connect mode on an unconnected block, pause on the block you want
to connect and click the Connect button ![]() . To enter connect mode on a connected block, select the
block, pause on the ellipsis that appears (…), and in the action menu that expands, click
the Connect button.
. To enter connect mode on a connected block, select the
block, pause on the ellipsis that appears (…), and in the action menu that expands, click
the Connect button.
To connect a display block to a signal in your model or change the connection of a display
block, enter connect mode. Select the signal line to which you want to connect. From the
list that appears, select the signal to which you want to connect. Then, pause on the
dashboard block and click the Done Connecting button ![]() . To see the dashboard block display the value of the
connected block, run the simulation.
. To see the dashboard block display the value of the
connected block, run the simulation.
For more information about connecting dashboard blocks, see Connect Dashboard Blocks to Simulink Model.
You can also connect dashboard blocks to a Stateflow® chart. For more information, see Connect Dashboard Blocks to Stateflow (Stateflow).
This animation shows how to connect the Dashboard Scope block to your model.
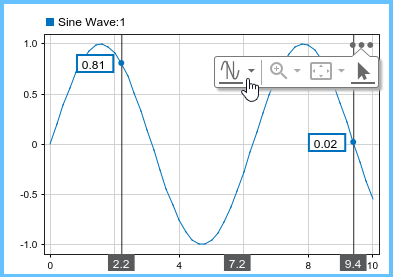
Analyze Signal Data
You can use the subplot menu or the context menu for the Dashboard Scope block to:
Show or hide data cursors.
Zoom out by a fixed amount.
Configure the mouse interaction to pan and select or to zoom in time, in y, or in both time and y.
Perform a fit-to-view in time, in y, or in both time and y.
Note
To use keyboard shortcuts to analyze data, select a signal or axis in the Dashboard Scope block.
To access the subplot menu, select the Dashboard Scope block then click the three dots that appear when you pause on the plot area.
Configure Signal Line Style and Color
You can modify the color and line style for signals connected to a Dashboard Scope block using the Connection table in the Block Parameters dialog box or the Property Inspector. To modify the appearance of a connected signal:
Click the preview of the signal appearance in the Style column of the Connection table.
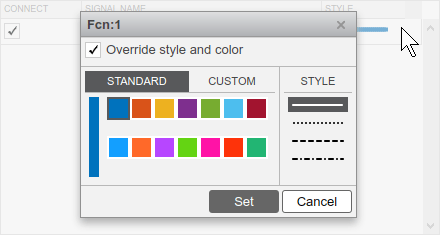
Choose a color from the palette of standard colors or select the Custom tab to specify a custom color using
RGBvalues between0and255.Select the line style from the solid, dotted, dashed, and dot-dashed options in the Style column.
Click Set.
When you mark a signal connected to the Dashboard Scope block for signal logging, you can also configure the signal color and line style using the Instrumentation Properties dialog box. In the signal color and line style menu for the Dashboard Scope block, the Override style and color option is selected by default and specifies whether signal appearance options you choose using the Connection table for the Dashboard Scope block override signal appearance options configured in the instrumentation properties for the connected signals.
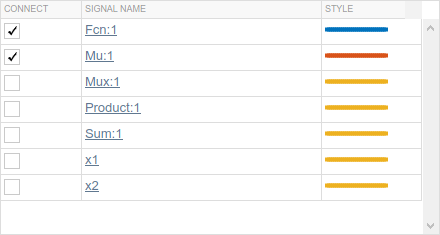
When you connect signals to the Dashboard Scope block using the Block Parameters dialog box, the connection table shows the default signal color and line style for each signal you connect. As you select signals to connect, the Connection table updates the style and color for signals that are not selected to indicate the style and color for the next signal you connect.
Configure Complex Signal Format
When you connect a complex signal to the Dashboard Scope block, you can configure how the signal is displayed by specifying the Complex Format property for the signal:
Mark the complex signal for signal logging.
Right-click the logging badge for the complex signal, and then click the Properties button
 .
.
Specify the Complex Format.
Click OK.
When you specify the Complex Format for a signal as
Real-Imaginary or
Magnitude-Phase, the Dashboard Scope
block displays both components of the signal. The real or magnitude component is
displayed using the color indicated in the Connection table.
The imaginary or phase component is displayed using a different shade of the color
indicated in the Connection table.
Examples
You can use the Dashboard Scope block to plot connected signals during simulation. For example, the model dashScope contains a Dashboard Scope block that is connected to three signals: constSig, rampSig, and sineSig.
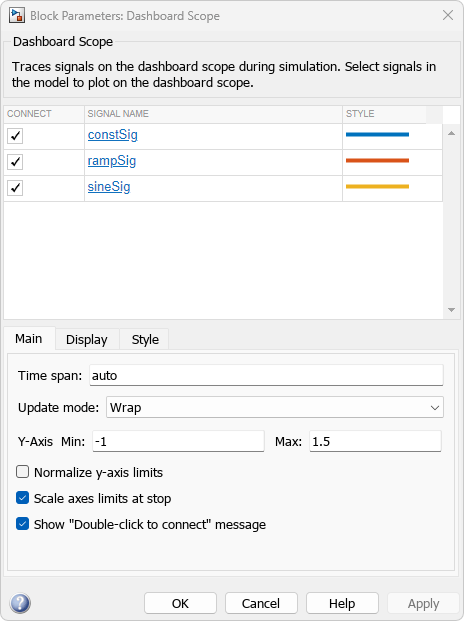
Simulate the model. During simulation, the constSig, rampSig, and sineSig signals stream to the Dashboard Scope block.
Extended Examples

Model Fault-Tolerant Fuel Control System
Combine Stateflow® and Simulink® capabilities to model hybrid systems. This type of modeling is particularly useful for systems that have numerous possible operational modes based on discrete events. Traditional signal flow is handled in Simulink while changes in control configuration are implemented in Stateflow. The model described in this example represents a fuel control system for a gasoline engine. The system is robust in that it detects individual sensor failures, and the control system is dynamically reconfigured for uninterrupted operation.
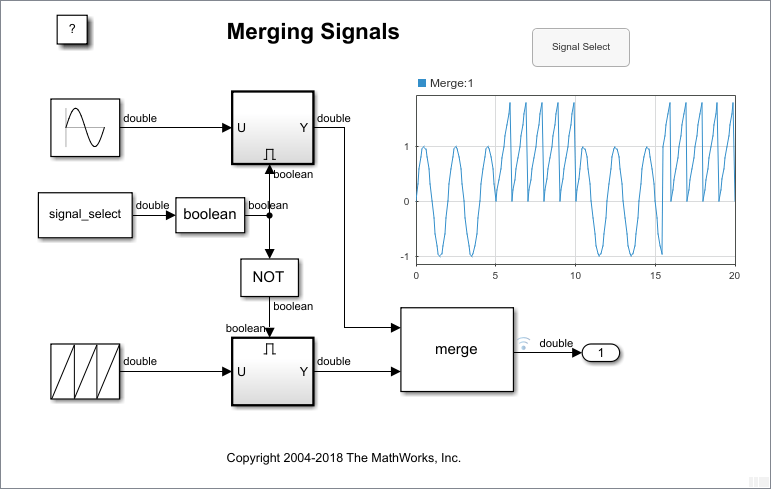
Control Merging Signals with the Push Button Block
Use the Push Button block to control signal that passes to
output in the model mergedemo.
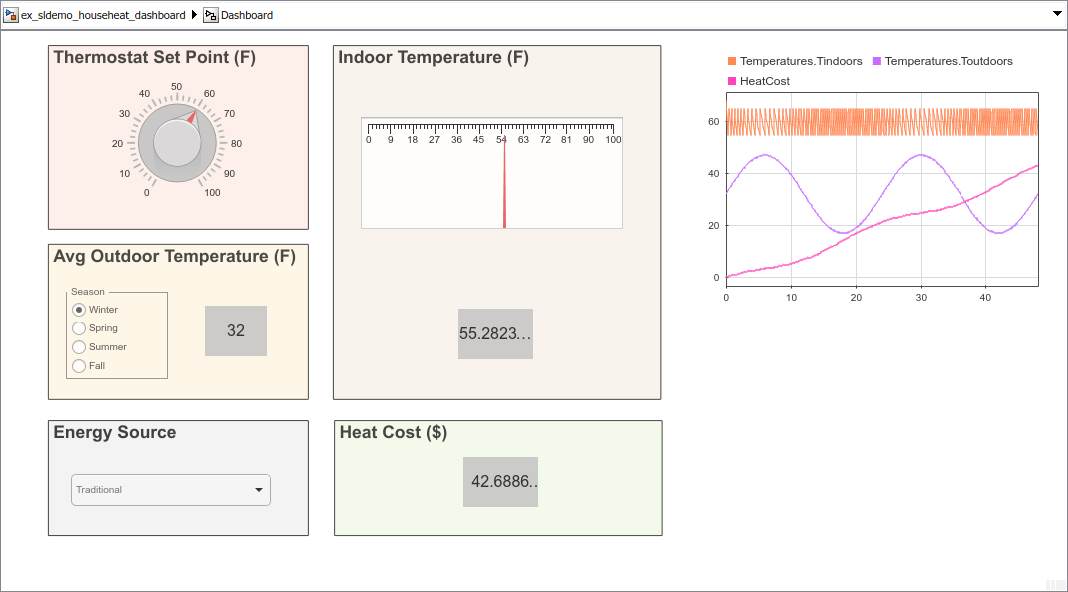
Interactively Simulate Thermal Model of House
Use Dashboard blocks to configure and then interactively simulate a thermal model of a house.
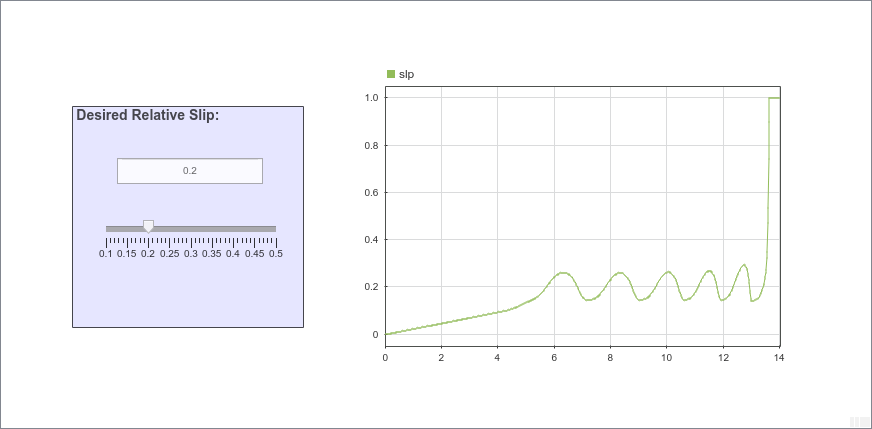
Tune the Relative Slip for an Anti-Lock Braking System
Tune the relative slip in a model of an anti-lock braking system using Dashboard blocks.
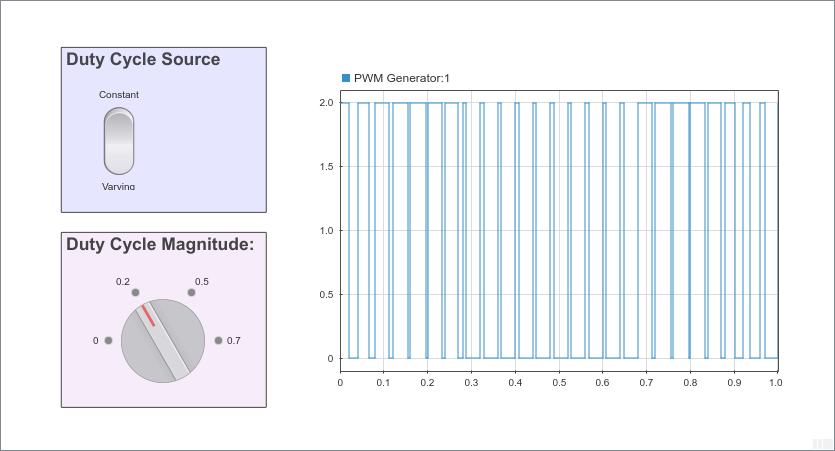
Control the Duty Cycle of a PWM Signal Using Dashboard Blocks
Control the generation of a PWM signal from a dashboard of controls and displays.

Interactively Simulate Vehicle Climate Control System
Use a dashboard of controls and indicators to interact with the simulation of an automobile climate control system.
Limitations
You cannot use the Connection table to connect a dashboard block to a block that is commented out. When you connect a dashboard block to a commented block using connect mode, the dashboard block does not display the connected value until the you uncomment the block.
The toolstrip does not support dashboard blocks that are in a panel.
Dashboard blocks cannot connect to signals inside referenced models.
When you simulate a model hierarchy, dashboard blocks inside referenced models do not update.
Dashboard blocks do not support rapid accelerator simulation.
During simulation, you cannot connect a dashboard block to Stateflow chart data or state activity.
You cannot programmatically connect a dashboard block to Stateflow chart data or state activity.
Some signals do not have data available during simulation due to block reduction or optimization for accelerator mode simulations. To view such a signal using a dashboard block, mark the signal for logging.
Parameters
Block Characteristics
Data Types |
|
Direct Feedthrough |
|
Multidimensional Signals |
|
Variable-Size Signals |
|
Zero-Crossing Detection |
|