plotxy
Plot series associated with two node objects against each other
Description
fh = plotxy(x,y)y along the
y-axis, with series values of node x along
the x-axis. fh is a cell array of handles to
the resulting figures. x and yare
simscape.logging.Node objects or homogeneous cell arrays of such objects.
Each object must be a simulation variable node (one that has a direct child series). The
values of this child series are plotted along the respective axis. All series must have the
same time vectors. If x and y are cell arrays,
they must be of the same size, or one of them can be a scalar.
fh = plotxy(x,y,Name,Value)Name,Value pair
arguments. For example, specify 'time' followed by a 1x2 vector,
[, to plot only the data within this time
range.start_time
end_time]
Examples
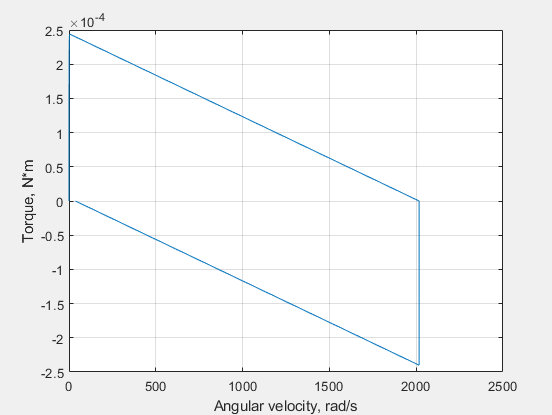
Plot the motor torque variable node against its angular velocity variable node.
Open the Permanent Magnet DC Motor example model:
openExample('simscape/PermanentMagnetDCMotorExample')
This example model has data logging enabled for the whole model, with the
Workspace variable name parameter set to
simlog_PermanentMagnetDCMotor.
Simulate the model to log the simulation data:
sim('PermanentMagnetDCMotor');Plot the motor torque against its angular velocity:
simscape.logging.plotxy(simlog_PermanentMagnetDCMotor.DC_Motor.Rotational_Electromechanical_Converter.R.w,...
   simlog_PermanentMagnetDCMotor.DC_Motor.Inertia.t)
When you plot the variable nodes against each other, the default plot displays the name of the variable and the unit name along each axis. To customize the axis names, use name-value pair arguments.
simscape.logging.plotxy(simlog_PermanentMagnetDCMotor.DC_Motor.Rotational_Electromechanical_Converter.R.w,...
   simlog_PermanentMagnetDCMotor.DC_Motor.Inertia.t,'xname','Angular velocity','yname','Torque')
Input Arguments
Name-Value Arguments
Output Arguments
Version History
Introduced in R2010b