Model LO Phase Noise
This example shows how to model and visualize LO phase noise. A mixer transfers local oscillator (LO) phase noise directly to its output.
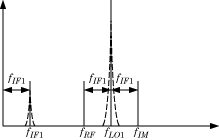
The preceding figure shows the transfer of phase noise from  to
to  .
.
Create Model with Phase Noise
The model ex_simrf_phase_noise introduces phase noise into the model from the example, Carrier to Interference Performance of Weaver Receiver. The first mixing stage downconverts the RF and image to  . To open the model:
open_system('ex_simrf_phase_noise')

View Simulation Output
The model uses Spectrum Analyzer to generate 5 plots.

The Phase Noise spectrum scope shows a single-sided power density spectrum measuring the phase noise level at the LO1 source versus frequency offset shown in logarithmic scale.
The IF1 spectrum scope shows a power spectrum centered at the first intermediate frequency, measured between the first and second stages.
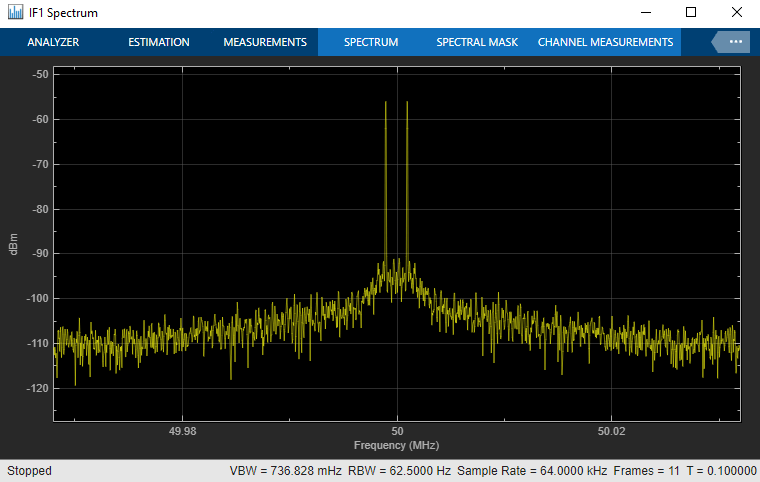
The scope shows that the LO phase noise has been transferred to the image. The RF signal on the carrier is not visible in the figure because its power level is below the phase noise power of the downconverted image signal.
The Output spectrum scope shows the downconverted RF with the images removed.
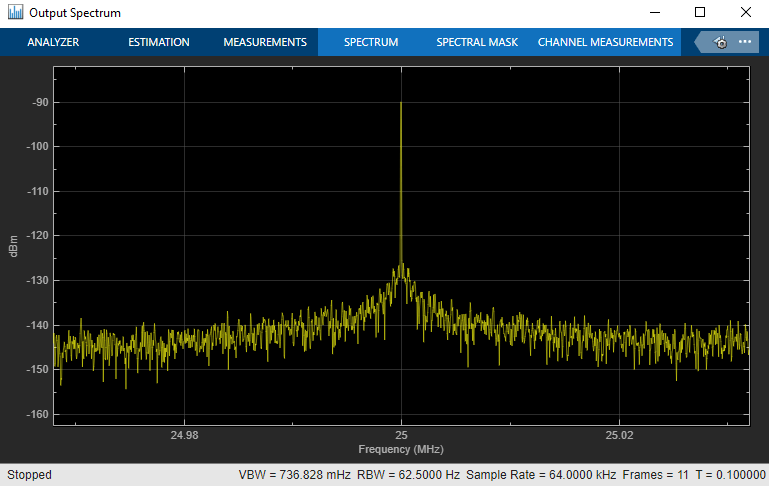
The LO phase noise has been transferred to the receiver output.
Shaping LO Noise Skirt
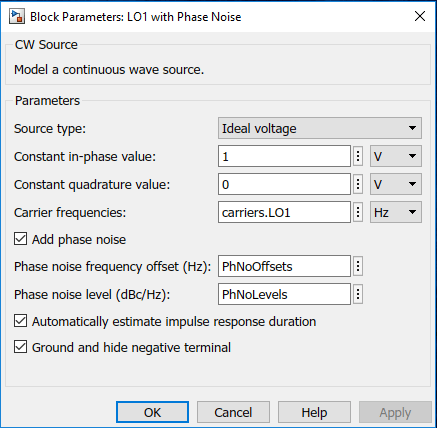
As seen in the phase noise scope, the added phase noise is pink (1/f) and is specified within the CW source LO1. Specifically, the Add phase noise checkbox is checked in the block parameters dialog box:
The phase noise frequency offset, PhNoOffsets, and phase noise level, PhNoLevels, variables are defined in the models PreLoadFcn callback, accessible through SETUP > Model Settings > Model Properties:

The upper limit of the offset frequency is governed by the sample time and is limited to the envelope bandwidth of the simulation. The lower limit of the offset frequency is governed by the duration of the impulse response generating the phase noise frequency profile. Increasing the duration length in time steps from 128 to 256 will double the frequency resolution and allow simulation of the 1/f profile down to 250Hz (as opposed to the current lower limit of 500 Hz).
See Also
Noise Figure Testbench | <docid:simrf_ref#bvfxprs-1>