countLabelValues
Count label values
Description
cnt = countLabelValues(lss,lblname)lblname and returns results in
table cnt. cnt contains label value counts and
percentages. When lblname is an ROI or point label,
cnt also contains the number of members with at least one value of a
particular category. countLabelValues does not support:
Sublabels
Label definitions with the LabelDataType property set to
'table'or'timetable'Labels with instance values that cannot be converted to a vector with a discrete set of categories. It must be possible to group label values using a set of unique discrete categories. Examples of labels that are not supported include:
Cell arrays of timetables
Cell arrays containing matrices of different sizes
Examples
Load a labeled signal set containing recordings of whale songs.
load whales
lss
lss =
labeledSignalSet with properties:
Source: {2×1 cell}
NumMembers: 2
TimeInformation: "sampleRate"
SampleRate: 4000
Labels: [2×3 table]
Description: "Characterize wave song regions"
Use labelDefinitionsHierarchy to see a list of labels and sublabels.
Use setLabelValue to add data to the set.
Get the names of the labels in the set.
getLabelNames(lss)
ans = 3×1 string
    "WhaleType"
    "MoanRegions"
    "TrillRegions"
Verify that the two members of the set are blue whales.
countLabelValues(lss,"WhaleType")ans=3×3 table
WhaleType Count Percent
_________ _____ _______
blue 2 100
humpback 0 0
white 0 0
Verify that each member has three moan regions.
countLabelValues(lss,"MoanRegions")ans=2×4 table
MoanRegions Count Percent MemberCount
___________ _____ _______ ___________
false 0 0 0
true 6 100 2
Verify that each member has one trill region.
countLabelValues(lss,"TrillRegions")ans=2×4 table
TrillRegions Count Percent MemberCount
____________ _____ _______ ___________
false 0 0 0
true 2 100 2
Specify the path to a set of audio signals included as MAT files with MATLAB®. Each file contains a signal variable and a sample rate. List the names of the files.
folder = fullfile(matlabroot,"toolbox","matlab","audiovideo");
lst = dir(append(folder,"/*.mat"));
nms = {lst(:).name}'
nms = 7×1 cell
    {'chirp.mat'   }
    {'gong.mat'    }
    {'handel.mat'  }
    {'laughter.mat'}
    {'mtlb.mat'    }
    {'splat.mat'   }
    {'train.mat'   }
Create a signal datastore that points to the specified folder. Set the sample rate variable name to Fs, which is common to all files. Generate a subset of the datastore that excludes the file mtlb.mat. Use the subset datastore as the source for a labeledSignalSet object.
sds = signalDatastore(folder,SampleRateVariableName="Fs");
sds = subset(sds,~strcmp(nms,"mtlb.mat"));
lss = labeledSignalSet(sds);
Create three label definitions to label the signals:
Define a logical attribute label that is true for signals that contain human voices.
Define a numeric point label that marks the location and amplitude of the maximum of each signal.
Define a categorical region-of-interest (ROI) label to pick out nonoverlapping, uniform-length random regions of each signal.
Add the signal label definitions to the labeled signal set.
vc = signalLabelDefinition("Voice",LabelType="attribute", ...
    LabelDataType="logical",DefaultValue=false);
mx = signalLabelDefinition("Maximum",LabelType="point", ...
    LabelDataType="numeric");
rs = signalLabelDefinition("RanROI",LabelType="ROI", ...
    LabelDataType="categorical",Categories=["ROI" "other"]);
addLabelDefinitions(lss,[vc mx rs])
Label the signals:
Label
'handel.mat'and'laughter.mat'as having human voices.Use the
islocalmaxfunction to find the maximum of each signal. Label its location and value.Use the
randROIfunction to generate as many regions of length N/10 samples as can fit in a signal of length N given a minimum separation of N/6 samples between regions. Label their locations and assign them to theROIcategory.
When labeling points and regions, convert sample values to time values. Subtract 1 to account for MATLAB array indexing and divide by the sample rate.
kj = 1;
while hasdata(sds)

    [sig,info] = read(sds);
    fs = info.SampleRate;

    [~,fn] = fileparts(info.FileName);
    if fn=="handel" || fn=="laughter"
        setLabelValue(lss,kj,"Voice",true)
    end

    xm = find(islocalmax(sig,MaxNumExtrema=1));
    setLabelValue(lss,kj,"Maximum",(xm-1)/fs,sig(xm))

    N = length(sig);
    rois = randROI(N,round(N/10),round(N/6));
    setLabelValue(lss,kj,"RanROI",(rois-1)/fs, ...
        repelem("ROI",size(rois,1)))

    kj = kj+1;

end
Verify that only two signals contain voices.
countLabelValues(lss,"Voice")ans=2×3 table
Voice Count Percent
_____ _____ _______
false 4 66.667
true 2 33.333
Verify that two signals have a maximum amplitude of 1.
countLabelValues(lss,"Maximum")ans=5×4 table
Maximum Count Percent MemberCount
______________________ _____ _______ ___________
0.80000000000000004441 1 16.667 1
0.89113331915798421612 1 16.667 1
0.94730769230769229505 1 16.667 1
1 2 33.333 2
1.0575668990330560071 1 16.667 1
Verify that each signal has four nonoverlapping random regions of interest.
countLabelValues(lss,"RanROI")ans=2×4 table
RanROI Count Percent MemberCount
______ _____ _______ ___________
ROI 24 100 6
other 0 0 0
Create two datastores with the data in the labeled signal set:
The
signalDatastoreobjectsdcontains the signal data.The
arrayDatastoreobjectldcontains the labeling information. Specify that you want to include the information corresponding to all the labels you created.
[sd,ld] = createDatastores(lss,["Voice" "RanROI" "Maximum"]);
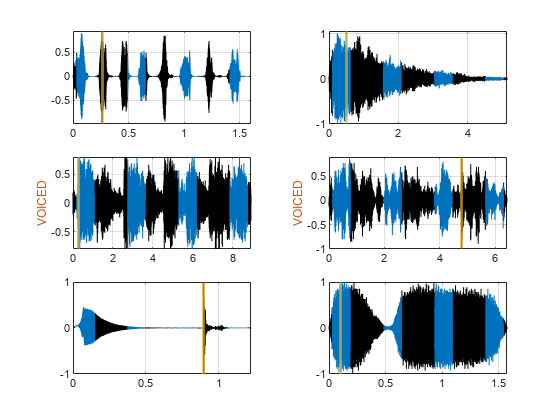
Use the information in the datastores to plot the signals and display their labels.
Use a
signalMaskobject to highlight the regions of interest in blue.Plot yellow lines to mark the locations of the maxima.
Add a red axis label to the signals that contain human voices.
tiledlayout flow

while hasdata(sd)

    [sg,nf] = read(sd);

    lbls = read(ld);

    nexttile

    msk = signalMask(lbls{:}.RanROI{:},SampleRate=nf.SampleRate);
    plotsigroi(msk,sg)
    colorbar off
    xlabel('')

    xline(lbls{:}.Maximum{:}.Location, ...
        LineWidth=2,Color="#EDB120")

    if lbls{:}.Voice{:}
        ylabel("VOICED",Color="#D95319")
    end

end
function roilims = randROI(N,wid,sep)

num = floor((N+sep)/(wid+sep));
hq = histcounts(randi(num+1,1,N-num*wid-(num-1)*sep),(1:num+2)-1/2);
roilims = (1 + (0:num-1)*(wid+sep) + cumsum(hq(1:num)))' + [0 wid-1];

end
Input Arguments
Output Arguments
Version History
Introduced in R2021a