Analyze Parallel Links with Parallel Link Designer
R2026bLearn how to configure and explore the design space of a parallel link project and analyze the waveforms. You can sweep different parameters and evaluate their impact on your design's performance using the Parallel Link Designer app.
Create New Project
Open the Parallel Link Designer app.
parallelLinkDesigner
In the newly opened pop-up window, click the Create New button. In the New Project dialog box, select the path where you want to save your project. Name the project as parallel_link, the interface as ddr, and the schematic sheet as channel. Confirm that the Auto-Generate Topology is selected. Select the Single-ended radio button.
The Pre-Layout Analysis tab shows the schematic sheet with a transmitter, a receiver, and a transmission line with default values.
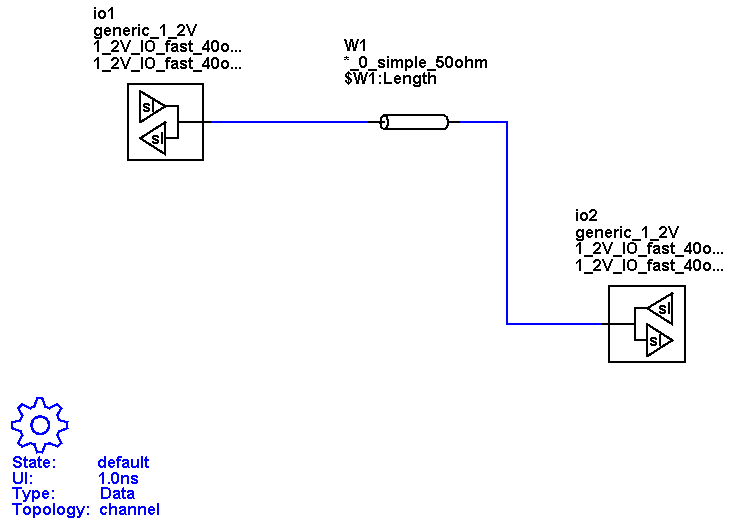
Double click the io1 transmitter to open the Designator Element Properties dialog box. Click the Transfers & Models button, then click the Edit Designator Parts/Pins button in the newly opened pop-up window. Select gddr3 as the Part Name from the dropdown menu. Select gddr3_O_40from the list of Available Single Ended Models/Pins and assign it to io1. Similarly, for io2, select gddr3 as part name and assign the pin gddr3_In to it.
Add a resistance R1 before the W1 transmission line.
Setup Simulation Parameters
Double click on the gear ( ) icon in the Pre-Layout Analysis tab to launch the Sheet Simulation Control dialog box. Set the unit interval for the transmitter to
 375 ps to by selecting 0.375ns - data_ddr_1333M from the dropdown menu. Close the Sheet Simulation Control dialog box.
Double click the io2 symbol to open the Designator Element Properties dialog box. Set the Model for io2 Designator to gddr3_I_60u.
Double click on the resistor symbol to launch the Resistor Element Properties dialog box. Enable Sweep Resistance parameter. Change the name of the Resistance parameter to $tl_res. Close the Resistor Element Properties dialog box.
Double click on the W-line symbol to launch the Lossy Transmission Line Element Properties dialog box. Check that Sweep Length parameter is enabled. Change the name of the Length parameter to $tl_len. Close the Lossy Transmission Line Element Properties dialog box.
In the Solution Space panel, select the Variable $tl_len. $tl_len already has 2in as Value1. Add the values 4in, 6in, 8in, and 10in to sweep the length of the transmission line.
Next, select the Variable $tl_res. Add the values 75 and 100 to sweep the resistance.
The updated schematic with the solution space looks like this:
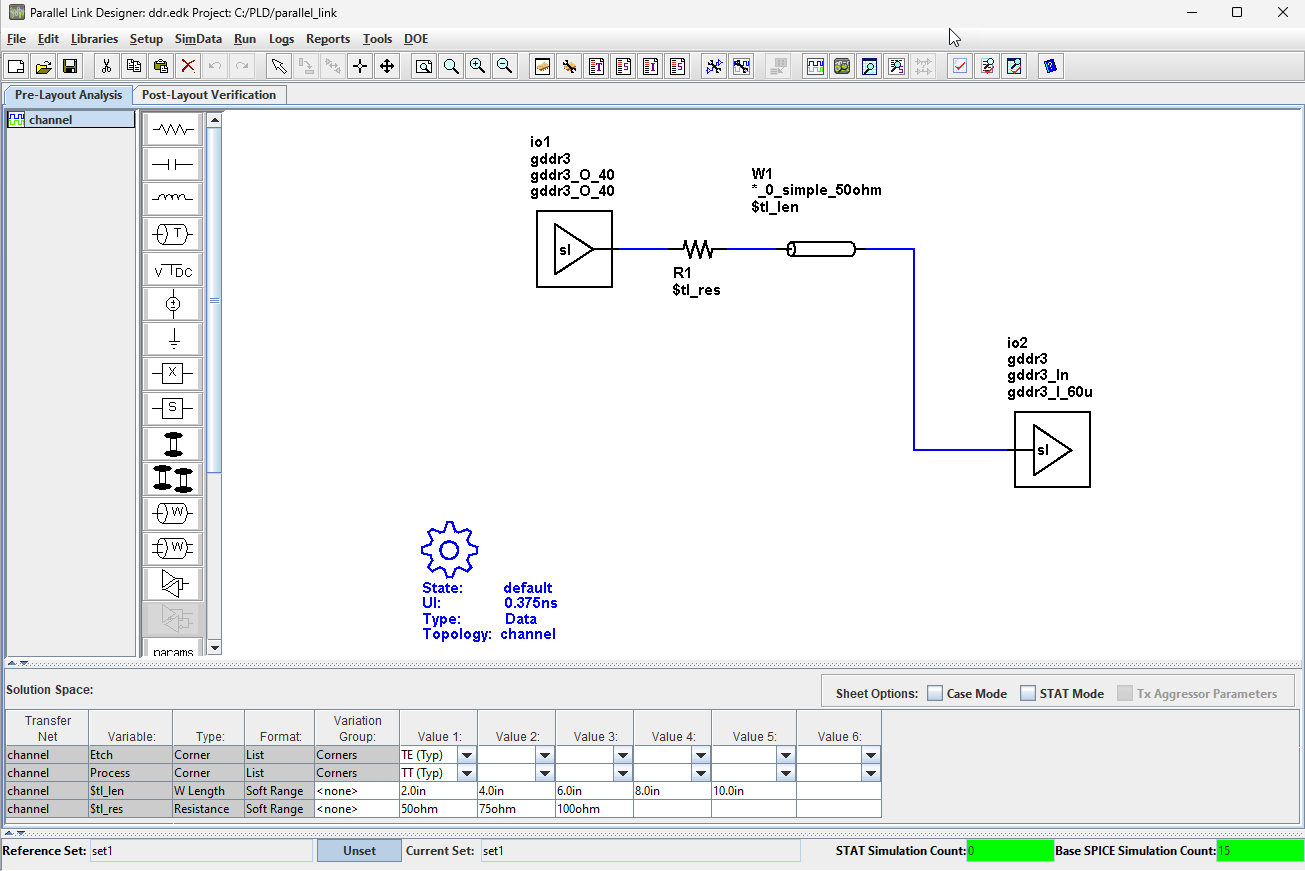
At the bottom right corner of the Solution Space panel, the Base SPICE Simulation Count should show 15. Save the changes.
Validate the schematic set by selecting Run > Validate Current Schematic Set. The validation should run without warning or errors.
Analyze Waveforms
To see the effects of sweeping the transmission line length and resistance, analyze the waveform.
Run the simulation by selecting Run > Simulate Selected. In the Prelayout Simulation dialog box, select Validate, Generate Netlists, Run SPICE, Analyze Waveforms, and Autoload Results. Click Run to start the simulation process.
When the analysis is finished the Signal Integrity Viewer app launches and loads the analysis results. The table has one row per simulation. You can sort by any column by clicking on the column header.
The Prelayout Channel Analysis dialog box shows that 387 warnings occurred while running waveform analysis. Click the Errors and Warnings button and select the Analyze Waveform tab in the newly opened Prelayout Errors and Warnings dialog box. The report says there are 387 waveform quality warnings.
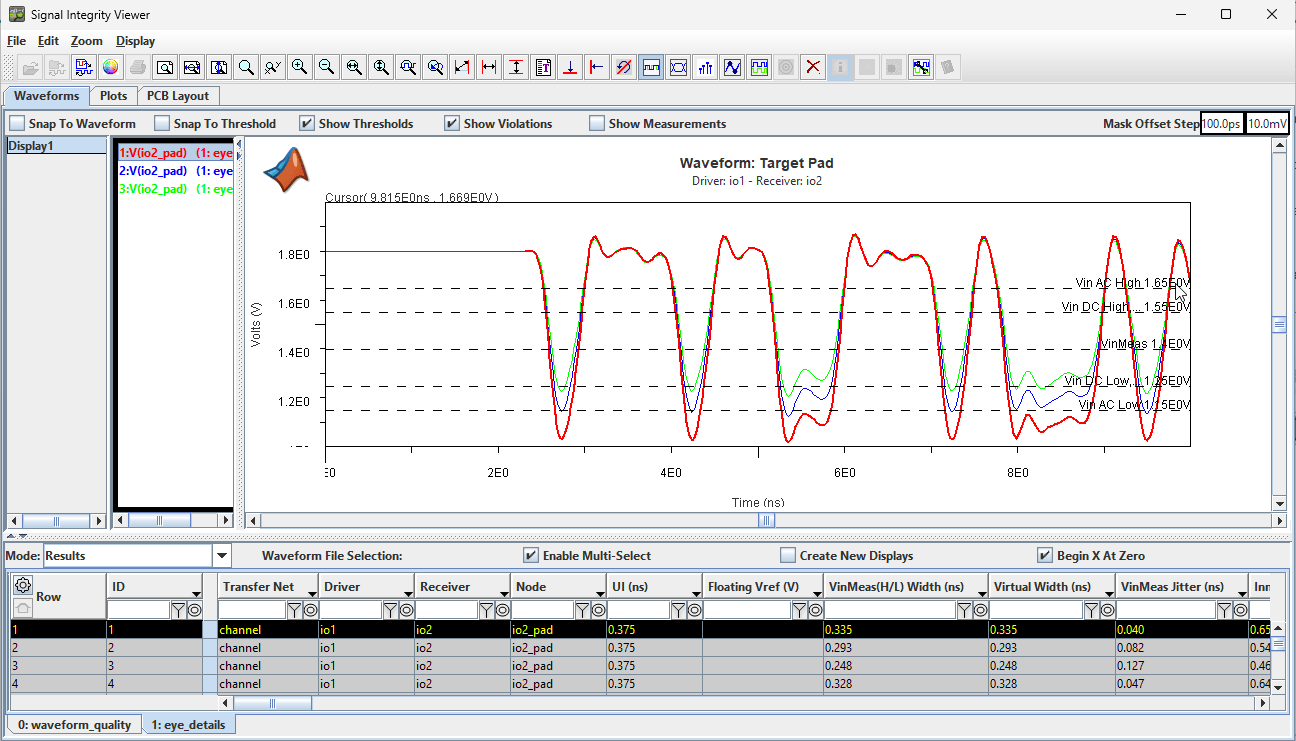
To view the effect of changing the resistance, in the Signal Integrity Viewer app, select the rows corresponding to transmission line length 2 in and resistor values 50 ohm, 75 ohm, and 100 ohm. Find the relevant rows by right clicking a row and selecting Show Solution Space. Select and right click all three rows and select Show Waveform > Target Pad. Zoom in between 0 to 10 ns along the x-axis and 1-2 V along the y-axis.
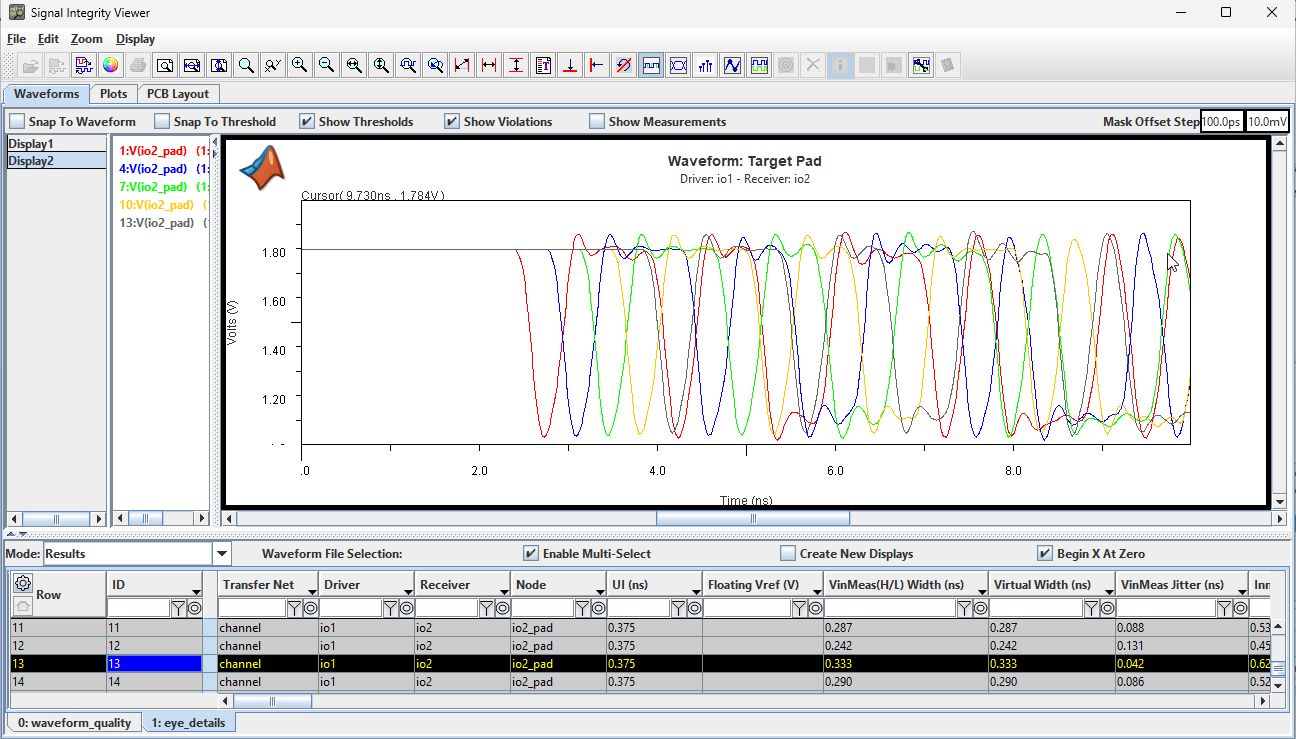
Similarly, to view the effect of changing the transmission line length, select the rows corresponding to 50 ohm resistance and 2 in, 4 in, 6 in, 8 in, and 10 in length.
Close the Signal Integrity Viewer app.
See Also
Parallel Link Designer | Signal Integrity Viewer

