Verify Generated Executable Program Results
Verify whether generated executable program results for the model match simulation results.
Configure Model for Verification
Configure the Dashboard Scope block to monitor the values of signals
Force: f(t):1andX. Double-click the Dashboard Scope block. In the Block Parameters dialog box, confirm that:The block is connected to signals
Force: f(t):1andX. To connect a Dashboard block to a signal, in the model canvas, select the signal. In the Block Parameters dialog box, select the signal name.Min is set to
-10.Max is set to
10.
Apply changes and close the dialog box.
Configure the Knob block so that you can use the knob to change the value of the damping gain. Double-click the Knob block. In the Block Parameters dialog box, confirm that:
The block is connected to parameter
Damping:Gain. To connect a Dashboard block to a parameter, in the model canvas, select the block that uses the parameter. In the Block Parameters dialog box, select the parameter name.Minimum is set to
200.Maximum is set to
600.Tick Interval is set to
100.
Apply changes and close the dialog box.
Open the Model Configuration Parameters dialog box. On the C Code tab, click Settings > C/C++ Code generation settings.
Configure the model such that Simulink® and the generated executable program log workspace data in the Simulation Data Inspector. Click Data Import/Export. Confirm that the model is configured with these settings:
Parameter Selected Name Set To Time toutStates xoutOutput youtSignal logging logsoutData stores dsmoutRecord logged workspace data in Simulation Data Inspector Configure the model for building an executable program. Click Code Generation. Confirm that parameter Generate code only is cleared.
Configure and validate the toolchain for building the executable program. Confirm that parameter Toolchain is set to
Automatically locate an installed toolchain.Click Advanced parameters. Then, under Advanced parameters click the Validate Toolchain button to generate and open the Validation Report. The Validation Report indicates which compiler is being used and whether the checks for this compiler passed.
Configure parameters and signals so that the data is stored in memory and is accessible while the executable program runs. To efficiently implement a model in C code, you do not allocate memory for every parameter, signal, and state in the model. If the model algorithm does not require data to calculate outputs, code generation optimizations eliminate storage for that data. To allocate storage for the data so that you can access it during prototyping, you disable some optimizations.
Click Code Generation > Optimization.
Confirm that Default parameter behavior is set to
Tunable. With this setting, block parameters, such as the Gain parameter of a Gain block, are tunable in the generated code.Click Advanced parameters. Then, under Advanced parameters, confirm that Signal storage reuse is cleared. With this setting, the code generator allocates storage for individual signal lines. While running the executable program, you can monitor the values of the signals.
Configure the code generator to produce nonfinite data (for example,
NaNandInf) and related operations. Click Code Generation > Interface. Confirm that parameter Support: non-finite numbers is selected.Configure a communication channel. For Simulink® to communicate with an executable program generated from a model, the model must include support for a communication channel. This example uses XCP on TCP/IP as the transport layer for a communication channel. Confirm these parameter settings:
External mode is selected.
Transport layer is set to
XCP
                                        on TCP/IP
. This selection specifiesext_xcpfor parameter Mex-file name.Automatically allocate static memory is selected.
Disable MAT-file logging. Load the data into the Simulation Data Inspector from the MATLAB® base workspace. Click Advanced parameters. Then, under Advanced parameters, confirm that parameter MAT-file logging is cleared.
Apply your configuration changes, close the Model Configuration Parameters dialog box, and save the model.
Simulate Model and View Results
From the Simulink Editor, in the Simulation tab, click Run. The clock on the Run button indicates that simulation pacing is enabled. Simulation pacing slows down a simulation so that you can observe system behavior. Visualizing simulations at a slower rate makes it easier to understand the underlying system design and identify design issues while demonstrating near real-time behavior.
During the simulation, the Dashboard Scope block displays the behavior of signals
Force: f(t):1andX.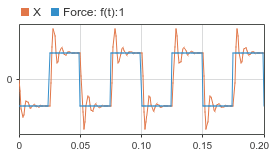
In the Simulink Editor, in the Simulation tab, click Data Inspector. The Simulation Data Inspector opens with data from your simulation run imported.
Expand the run (if not already expanded). Then, to plot the data, select data signals
XandForce: f(t):1.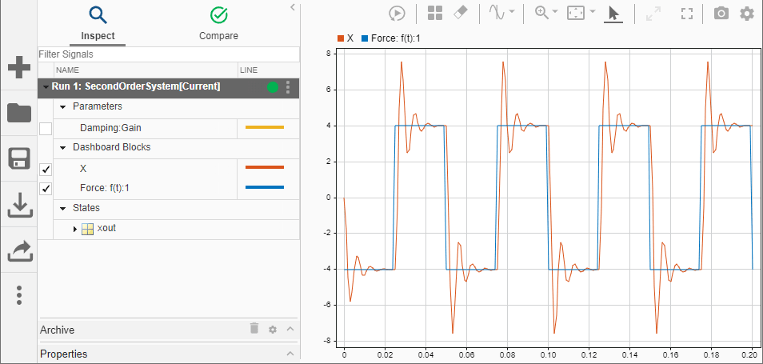
Leave these results in the Simulation Data Inspector. Later, you compare the simulation data to the output data produced by the executable program generated from the model.
Build and Run Executable Program and View Results
Build and run the model executable program.
In the Simulink Editor, in the Hardware tab, click Monitor & Tune
 to start the process. Simulink:
Builds the target application files, which include the executable file. The debugging symbols for signals are created as part of the executable file or in a separate file, depending on the configuration of Code Generation. To learn more about different configurations for Code Generation, see Approaches for Building Code Generated from Simulink Models.
Deploys the executable program as a separate process on your development computer.
Connects the Simulink model to the executable program.
Starts the model executable program code.
Compare Simulation and Executable Program Results
Use the Simulation Data Inspector to compare the executable program results with the simulation results.
In the Simulation Data Inspector, inspect the results of your executable program run,
Run 2: SecondOrderSystem.Click Compare.
Select the data runs that you want to compare. For this example, from the Baseline list, select
Run 1:
                            SecondOrderSystem
. From the Compare to list, selectRun 2: SecondOrderSystem.In the upper-right corner of the Simulation Data Inspector, click Compare.

The Simulation Data Inspector indicates that the comparisons for
XandForce: f(t):1from the executable program code is within tolerance of the simulation output. To see a plot of the results forX, under Filter Comparisons, expandDashboard Blocksand select the row forX.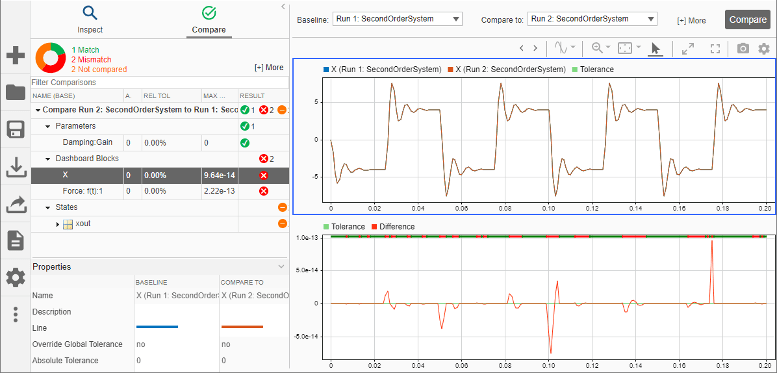
Inspect the comparison plot for
Force: f(t):1. Under Filter Comparisons, select the row forForce: f(t):1.
Next, tune a parameter during program execution.