Format Table Columns
This example shows how to apply formatting to the columns of a table in a report. You create a table, import data, and populate the table entries with the data. You programmatically format the entiretable by applying a table style. Then, you format the columns in the table by applying bold and color formatting styles, and specifying the alignment of the content in table entries by column.
Create a Document and Import Data
Import the Document Object Model (DOM) namespace. Create an HTML document, FormatColumns.
import mlreportgen.dom.*
doc = Document("FormatColumns","html");
Import the sample data set outages.csv as a table.
outages = readtable("outages.csv","TextType","string");
Create and Format Table
Create a formal table and a table row for the header.
table = FormalTable;
header = TableRow;
Add entries to the header for the variable names from the outages table. Apply bold formatting and size 14 pt font to the header row and append the row to the table.
for colNum = 1:width(outages)
    append(header,TableEntry(outages.Properties.VariableNames{colNum}));
end
header.Style = {Bold(true),FontSize("14pt")};
appendHeaderRow(table,header);
For the first 15 rows in the outages table, create a table row and append the row to table.
for rowNum = 1:15
    row=TableRow;
    for colNum = 1:width(outages)
        entry = Text(outages{rowNum,colNum});
        append(row,TableEntry(entry));
    end
    append(table,row);
end
Define a table style that adds a border and separators for the rows and columns. Set the text to size 12 pt font.
table.Style = {Border("solid"),RowSep("solid"),...
    ColSep("solid"),FontSize("12pt"),...
    ResizeToFitContents(true)};
Format Table Columns
Create a TableColSpecGroup object that spans six columns.
specGroup = TableColSpecGroup;
specGroup.Span = 6;
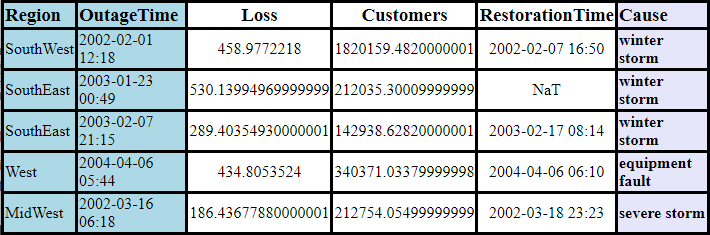
To format the first column in the table, create a TableColSpec object that spans two columns. Set the background color to light blue.
spec(1) = TableColSpec;
spec(1).Span = 2;
spec(1).Style = {BackgroundColor("lightblue")};
To format the next four columns, create a TableColSpec object that spans three columns. Set the horizontal alignment to center.
spec(2) = TableColSpec;
spec(2).Span = 3;
spec(2).Style = {HAlign("center")};
To format the last column in the table, create a TableColSpec object that spans one column. Apply bold formatting to the table entries and set the background color to lavender.
spec(3) = TableColSpec;
spec(3).Span = 1;
spec(3).Style = {Bold(true), BackgroundColor("lavender")};

specGroup.ColSpecs = spec;
table.ColSpecGroups = specGroup;
Append the table to the report. Then, view the report.
append(doc,table);
close(doc);
rptview(doc);
See Also
mlreportgen.dom.TableColSpec | mlreportgen.dom.TableColSpecGroup | mlreportgen.dom.FormalTable