wcsigmaplot
Plot worst-case gain of uncertain system
Description
wcsigmaplot( plots the nominal and
worst-case gains of the uncertain system usys)usys as a function of
frequency. For multi-input, multi-output (MIMO) systems, gain refers to the largest singular
value of the frequency response matrix. (See sigma for more information about singular values.) The plot includes:
Nominal — Nominal gain of
usys.Worst perturbation — The response falling within the uncertainty of
usysthat has the highest peak gain. This curve corresponds to thewcuoutput argument ofwcgain.Worst-case gain (lower bound) — The lowest possible worst-case gain at each frequency.
Worst-case gain (upper bound) — The highest possible gain within the uncertainty at each frequency. This curve represents the envelope produced by finding the highest possible gain at each frequency.
Sampled Uncertainty — Responses randomly sampled from
usys.
Examples
Plot the worst-case gain of the following system:
The uncertain parameter a = 2 1.
a = ureal('a',2);
usys = tf([1 3 0],[1 2 a]);
wcsigmaplot(usys)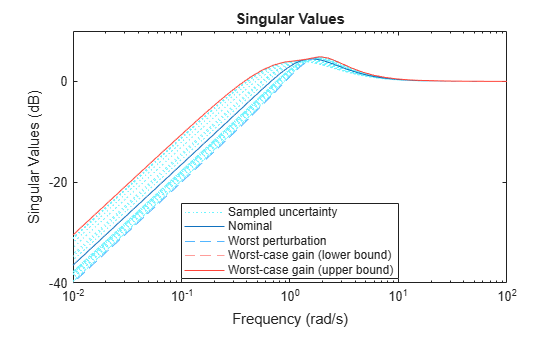
The Worst perturbation curve identifies the single response within the uncertainty that yields the highest gain at any frequency. This perturbation corresponds to the wcu output of wcgain.
The Worst-case gain curves show the lower and upper bounds on the worst-case gain at each frequency. For any perturbation within the specified uncertainty range, the principal gains (singular values) of the perturbed system lie below the Worst-case gain (upper bound) curve. In other words, this curve is the envelope produced by finding the highest gain within the uncertainty at each frequency. For this system, the lower and upper bounds are close enough to appear identical on the plot. (See wcgain for more information about these bounds.)
Focus the plot on the region between 0.1 and 10 rad/s.
w = {0.1 10};
wcsigmaplot(usys,w)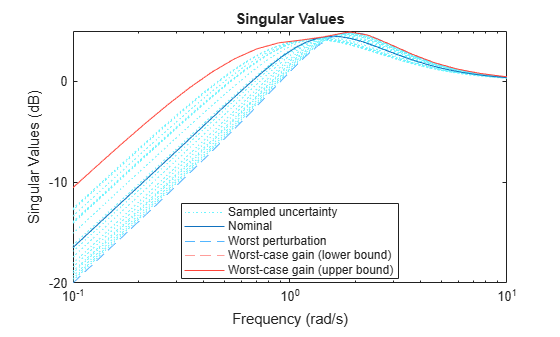
Examine the effect on the worst-case response of increasing the uncertainty range. To do this without changing the uncertainty specified in usys, use the ULevel option of wcOptions. This option scales the normalized uncertainty by the factor you specify. For example, examine the worst-case response a 50% greater uncertainty range.
opts = wcOptions('ULevel',1.5);
wcsigmaplot(usys,w,opts)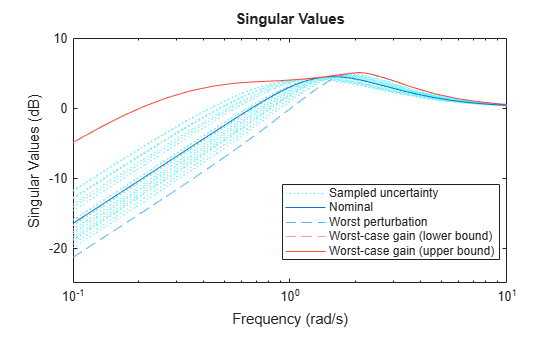
The plot shows that increasing the uncertainty range substantially increases the worst-case gain at low frequencies.
Input Arguments
Algorithms
wcsigmaplot uses wcgain to compute the worst-case gains. Use the opts
argument to set options for the wcgain algorithm.
wcsigmaplot uses usample to compute the Sampled Uncertainty curves.