plot
Visualize value-at-risk (VaR) or expected shortfall (ES) and portfolio data, and highlight exceptions
Since R2023b
Description
plot( plots the vectors and portfolio
data, where btobj)btobj is either an esbacktest (since R2024a) or a varbacktest object.
plot(
specifies additional plot styles using one or more name-value arguments. For example,
btobj,Name=Value)plot(btobj,Type="bar") specifies a bar-style plot.
hPlot = plot(___) returns a Line
object or an array of Line objects. Use the figure handle
hPlot to modify properties of the plot after creating it.
Examples
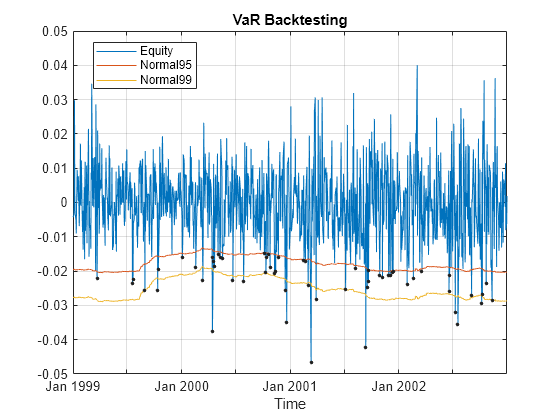
Plot varbacktest data as a line and highlight the exceptions as dot markers. The plot function highlights a loss as an exception with respect to any VaR value.
load VaRBacktestData
btobj = varbacktest(EquityIndex, ...
   [Normal95 Normal99], ...
   'PortfolioID',"Equity", ...
   'VaRID',{'Normal95' 'Normal99'}, ...
   'VaRLevel',[0.95 0.99], ...
   'Time',Date);
plot(btobj)
Use the select function to choose a smaller backtesting time window. Then, use the plot function to make a bar-style plot to highlight the exceptions for each VaR vector separately.
load VaRBacktestData
btobj = varbacktest(EquityIndex, ...
   [Normal95 Normal99], ...
   'PortfolioID',"Equity", ...
   'VaRID',{'Normal95' 'Normal99'}, ...
   'VaRLevel',[0.95 0.99], ...
   'Time',Date);
btobjQ2 = select(btobj,TimeRange=[datetime(2000,4,1),datetime(2000,6,30)]);
plot(btobjQ2,Type="bar")

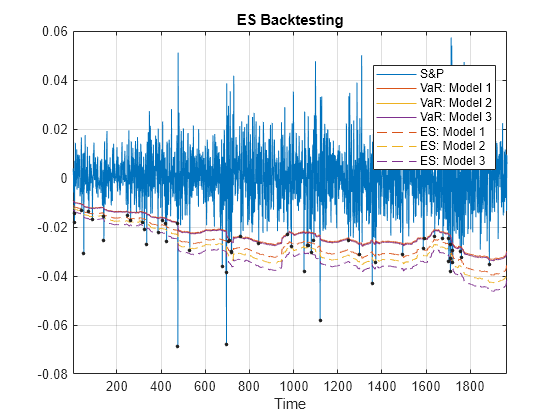
Plot esbacktest data as a line and highlight the exceptions as dot markers.
load ESBacktestData.mat
btobj = esbacktest(Returns,[VaRModel1 VaRModel2 VaRModel3], ...
       [ESModel1 ESModel2 ESModel3],'PortfolioID',"S&P", ...
       'VaRID',["Model 1","Model 2","Model 3"],'VaRLevel',VaRLevel);
plot(btobj);
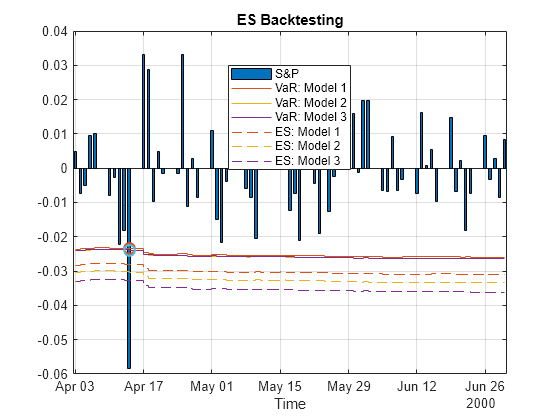
Use the select function to drill down into the second quarter of year 2000 and highlight the exceptions against each VaR vector separately.
load ESBacktestData.mat
etobj = esbacktest(Returns,[VaRModel1 VaRModel2 VaRModel3], ...
       [ESModel1 ESModel2 ESModel3],'PortfolioID',"S&P", ...
       'VaRID',["Model 1","Model 2","Model 3"],'VaRLevel',VaRLevel, ...
       'Time',Dates);
etobjQ2 = select(etobj,'TimeRange', ...
      [datetime(2000,4,1), datetime(2000,6,30)]);
plot(etobjQ2, Type="bar");
Input Arguments
Name-Value Arguments
Version History
Introduced in R2023bSee Also
varbacktest | esbacktest | bin | pof | tuff | cc | cci | tbf | tbfi | summary | runtests | append | exceptions | select