correlationDimension
Measure of chaotic signal complexity
Syntax
Description
corDim = correlationDimension(X)X. Correlation dimension is the measure of
dimensionality of the space occupied by a set of random points.
corDim is estimated as the slope of the correlation
integral versus the range of radius of similarity. Use
correlationDimension as a characteristic measure to
distinguish between deterministic chaos and random noise, to detect potential
faults.[1]
[
additionally estimates the range of radius of similarity and correlation
integral of the uniformly sampled time-domain signal corDim,rRange,corInt] = correlationDimension(___)X.
Correlation integral is the mean probability that the states of a system are
close at two different time intervals, which reflects self-similarity.
___ = correlationDimension(___,
estimates the correlation dimension with additional options specified by one or
more Name,Value)Name,Value pair arguments.
correlationDimension(___) with no output
arguments creates a correlation integral versus neighborhood radius plot.
Examples
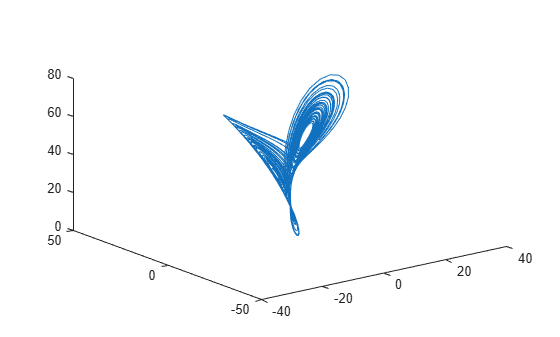
In this example, consider a Lorenz Attractor describing a unique set of chaotic solutions.
Load the data set and visualize the Lorenz Attractor in 3D.
load('lorenzAttractorExampleData.mat','data');
plot3(data(:,1),data(:,2),data(:,3));
For this example, use only x-direction data of the Lorenz Attractor. Since lag is unknown, estimate the delay using phaseSpaceReconstruction. Set 'Dimension' to 3 since the Lorenz Attractor is a three-dimensional system. The dim and lag parameters are required to create the correlation integral versus the neighborhood radius plot.
xdata = data(:,1);
dim = 3;
[~,lag] = phaseSpaceReconstruction(xdata,[],dim)
lag =
10
Create the correlation integral versus neighborhood radius plot for the Lorenz Attractor, using the lag value obtained in the previous step. Set an appropriate value for 'NumPoints' to determine a good resolution for the neighborhood radius.
Np = 100;
correlationDimension(xdata,lag,dim,'NumPoints',Np);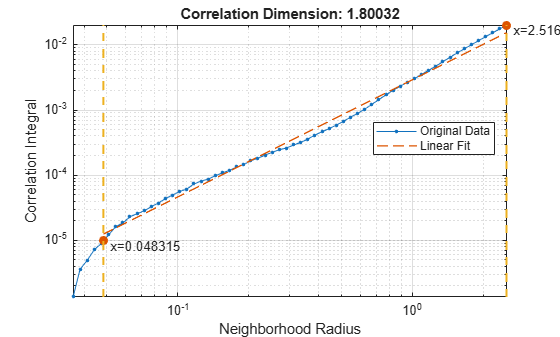
The first dashed, vertical green line (on the left) indicates the value of MinRadius, while the second vertical green line (on the right), represents MaxRadius. The dashed red line indicates the linear fit line for the correlation integral versus neighborhood radius data, within the computed range of radius.
To compute correlation dimension, you first need to determine the MinRadius and MaxRadius values needed for accurate estimation.
In the plot, drag the two dashed, vertical green lines to 'best fit' the linear fit line to the original data line to obtain the range of radius.
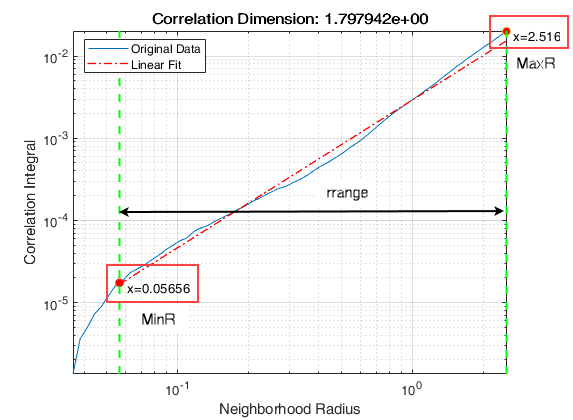
Note the new values of MinRadius and MaxRadius after dragging the two vertical lines for an appropriate fit.
Find the correlation dimension of the Lorenz Attractor, using the new MinRadius and MaxRadius values obtained in the previous step.
MinR = 0.05656;
MaxR = 2.516;
corDim = correlationDimension(xdata,[],dim,'MinRadius',MinR,'MaxRadius',MaxR,'NumPoints',Np)
corDim =
1.7490
The value of correlation dimension is directly proportional to the level of chaos in the system, that is, a higher value of corDim represents a high level of chaotic complexity in the system.
Input Arguments
Name-Value Arguments
Output Arguments
Algorithms
Correlation dimension is computed in the following way,
The
correlationDimensionfunction first generates a delayed reconstruction Y1:N with embedding dimension m, and lag τ.The software then calculates the number of with-in range points, at point i, given by,
where 1 is the indicator function, and R is the radius of similarity, given by, R = exp(linspace(log(rmin), log(rmax), N)). Here, rmin is
MinRadius, rmax isMaxRadius, and N isNumPoints.The correlation dimension
corDimis the slope of C(R) vs. R where, the correlation integral C(R) is defined as,
References
[1] Caesarendra, Wahyu & Kosasih, P & Tieu, Kiet & Moodie, Craig. "An application of nonlinear feature extraction-A case study for low speed slewing bearing condition monitoring and prognosis." IEEE/ASME International Conference on Advanced Intelligent Mechatronics: Mechatronics for Human Wellbeing, AIM 2013.1713-1718. 10.1109/AIM.2013.6584344.
[2] Theiler, James. "Efficient algorithm for estimating the correlation dimension from a set of discrete points". American Physical Society. Physical Review A 1987/11/1. Volume 36. Issue 9. Pages 44-56.
Extended Capabilities
Version History
Introduced in R2018a