Write C/C++ Unit Tests in Polyspace Platform User Interface
A C/C++ unit test calls one or more functions and checks if a function return value or other side effects of a function agree with expected values. You can author unit tests graphically in the Polyspace Platform user interface or by using a C/C++ xUnit-based API.
This example shows how to write and execute a test graphically in the Polyspace Platform user interface. This test invokes a single function with specific input values and verifies whether the function returns an expected value. For details about authoring tests using the xUnit API, see Write C/C++ Unit Tests Using Polyspace Test xUnit API and Run Tests at Command Line.
Example Files
To follow the steps in this tutorial, use the algo.c and saturate.c source files in the folder polyspaceroot\polyspace\examples\doc_pstest\getting_started_test_managerpolyspacerootC:\Program Files\Polyspace\R2026a.
This tutorial shows how to create a project and author tests in a stepwise manner. Alternatively, you can open a pre-configured project in the Polyspace Platform user interface and explore the various capabilities of Polyspace Test™. See Get Started with Polyspace Test Using Example Project.
Open Polyspace Platform User Interface
To open the Polyspace Platform user interface, double-click the desktop shortcut Polyspace Test R2026a. If you have not added a desktop shortcut during installation, double-click or otherwise start the following executable:
polyspaceroot\polyspace\bin\polyspace-desktop-ui.exe
polyspacerootC:\Program Files\Polyspace\R2026a.Check Compiler Setup
To analyze your source files and later build them, you require a compiler. If you have a supported compiler installed, it is automatically detected (except for MinGW, which requires additional setup). To see if a compiler has been detected:
On the toolstrip, select Settings.
On the Testing and Profiling tab, check the option C/C++ Host Compiler to see if a compiler has been detected.
This compiler is used during code analysis and project build on the host computer.
For more information on supported compilers, see Supported Host Compilers. If you are using Polyspace
Test on Windows® without a compiler previously installed, install MinGW in a path without spaces and set the environment variable MW_MINGW64_LOC to your install folder.
To install a supported MinGW version, select the link
Download MinGW 8.1in Support for MinGW-w64 C/C++ Compiler.For things to try if a compiler is not detected, see Troubleshoot Missing Compiler Error.
Most desktop Linux® distributions have GNU® C (GCC) installed by default and do not require additional setup for Polyspace Test.
Note that a supported compiler is required only to compile code generated by Polyspace Test during the build process. For compiling your sources and tests, you can continue to use any compiler that you are already using. For more information, see Specify C/C++ Compilers for Testing in Polyspace Platform User Interface.
Set Up Project
Create a project and add your source files to the project.
Click the New button in the toolstrip. Navigate to the location where you want to save the project, enter a project name, and click Save.
A project consists of this information in separate nodes:
Code — C/C++ source files.
Configuration — Build information, such as include paths and compiler flags.
Test Artifacts — Artifacts associated with code testing, such as function stubs and mocks.
Tests — One or more tests that you can write in graphical format or as scripts.
Right-click the Code node and select Add Source File. Alternatively, click the Add Source File button in the toolstrip. Select the source files
algo.candsaturate.cand add them to your project.
Specify Build Information
Configure your project to specify any information that might be required for building. For instance, if you have multiple compilers installed and do not want to use the default compiler for building tests, you can switch to another compiler in the project configuration:
To see the configuration, double-click the Configuration node of the project or click Configuration on the Project tab of the toolstrip.
On the Build tab, select the Target & Compiler node. To use the default compiler, leave the option Compilation toolchain (Testing) set to
Detect automatically. Otherwise, select another compiler and associated toolchain.
For more information on configuring your project, see Configure Project for Testing in Polyspace Platform User Interface.
Parse Source Code to Autopopulate Test Information
Before writing test cases, analyze the source files to extract information such as functions, input parameters, and global variables. Later, when you write tests, the Polyspace Platform user interface presents a list of functions to test based on this analysis. After you select a function, Polyspace Test automatically populates the function inputs, used global variables, and other information.
To analyze source files:
Select Parse Code on the toolstrip.
After the analysis completes, check the Projects pane. On this pane, below each file, you see the functions defined in the file. You can start writing graphical tests for these functions.
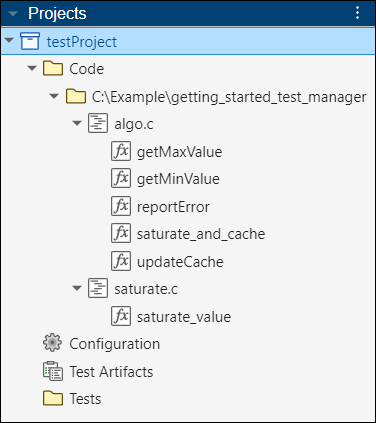
You can view source code in the Polyspace Platform user interface, but you cannot edit it. To view the location of a function in the source code, double-click the function name in the Projects pane. In this example, double-click the function saturate_value. This function returns:
Its input if the input is within the range -2 to 2.
-2 or 2 if the input is less than or greater than those limits.
For more information on code analysis, see Parse Source Code for Auto-Populating Test Information in Polyspace Platform User Interface.
Stub Undefined Functions and Variables
Before authoring tests, you might have to stub undefined functions and variables in your code. You can stub undefined functions before building your tests or create stubs as needed while building your tests.
The example project contains an undefined function, printError, and two undefined variables, minValue and maxValue. To stub undefined functions and variables:
Click the Code Explorer button
 in the toolstrip to see all functions in the project. Undefined functions and variables appear under the Undefined Symbols node.
Right-click the function or variable name and select Create Stub. If you leave the fields blank and select Apply, Polyspace Test generates a default stub.
Do not edit the default stub for
printError(const char *). Enter 2 forint maxValueand -2 forint minValue.
For more information on stubs, see Test Functions with Undefined Callees in Polyspace Platform User Interface.
Write Test Case
The simplest test that you can author calls a single function with specified input values. The test compares the return value and any global variable against expected values that you specify.
Write a simple test for the saturate_value function:
On the Projects pane, right-click the
saturate_valuenode and select Add Test Case.Alternatively, click the Code Explorer button
in the toolstrip to see all functions in the project (including functions defined in headers that do not show up in the project tree). Locate the function saturate_value, right-click the function, and select Add Test Case.On the New Test Case pane, update the test Name to
Pass Test Case. The pane name changes to Pass Test Case. You can optionally add a description.In the Step section, you can see the following:
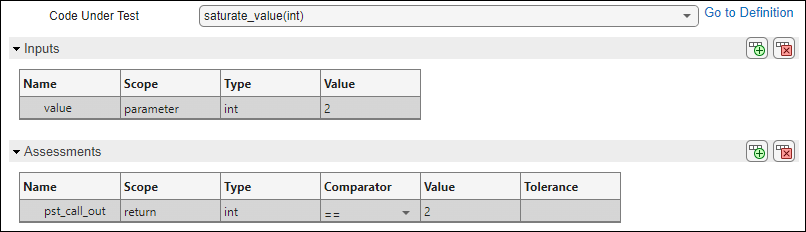
The function
saturate_value(int)is selected as Code Under Test.To see the definition of the selected function, click Go to Definition next to the function. Click the Pass Test Case tab to return to the test.
The Inputs, Assessments, and Callees sections are prepopulated with the information about the function.
In the Inputs subsection, specify values for all your variables. For this example, enter the integer
2in the Value column for the input variablevalue.For more information on specifying inputs of various data types, see Specify Test Inputs in Polyspace Platform User Interface.
In the Assessments subsection, define one or more assessments for the function return value or global variables modified by the function. An assessment consists of a value and a comparison operator such as
==. For this example, enter 2 in the Value column for variablepst_call_outand==in the Comparator column. The variablepst_call_outrepresents the function return value.For more information on specifying assessments, see Specify Test Assessments in Polyspace Platform User Interface.
Once you specify the input and assessment values, you can build and run the test. You can also see the code generated for this test. To see the test code, click the Test Code button on the Test Case tab of the toolstrip. You cannot edit this generated code.
Create a second test case using these settings:
Name —
Fail Test CaseCode Under Test —
saturate_value(int)Inputs — Set
valueto2.Assessments — Set
pst_call_outto10with the Comparator set to==.
Enable Code Coverage
Polyspace Test can calculate code coverage metrics that determine how much of your code is covered by the tests. Enable code coverage calculation by selecting Code Coverage instead of No Profiling in the Profiling section of the toolstrip. For more information, see Calculate C/C++ Code Profiling Metrics on Target in Polyspace Platform User Interface.
Build and Run Tests
Build your test project and run one or more tests:
Click Build Project on the toolstrip.
If a build error occurs, the Logs pane shows the error in red. Expand Build Logs above the error message to see more context around the error.
Click Run Tests on the toolstrip to run all of your tests.
You can also run individual test cases. Below the Tests node of the project, right-click a test case and select Run Test.
Review Results
After the run completes, you see the following:
The Recent Results pane shows a summary of the results. If there are multiple runs, this pane shows a summary of results from the most recent runs.
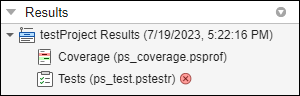
The Results pane shows the results for all runs.
On the Results pane, you see two sets of results on separate nodes for the current run:
Tests — This node corresponds to test execution results. If the Tests node shows the
 icon, at least one test case failed.
Coverage — This node corresponds to code coverage results and appears only when coverage computation was enabled.
Double-click a node on the Results pane to see details about passing and failing tests or code coverage. For more information, see:
See Also
Topics
- Configure Project for Testing in Polyspace Platform User Interface
- Parse Source Code for Auto-Populating Test Information in Polyspace Platform User Interface
- Specify Test Inputs in Polyspace Platform User Interface
- Specify Test Assessments in Polyspace Platform User Interface
- Review C/C++ Test Execution Results