Code Metrics Dashboard in Polyspace Access Web Interface
To view the code complexity metrics that Polyspace® computes, use the Code Metrics dashboard. See Code Metrics (Polyspace Bug Finder).
Polyspace computes the code complexity metrics during an analysis only when you use
the option Calculate code metrics
(-code-metrics) (Polyspace Bug Finder).

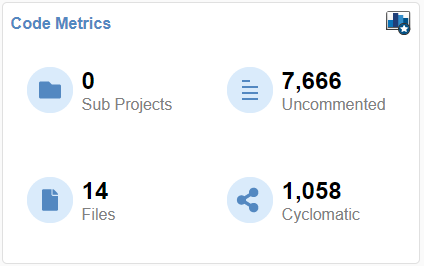
In the Project Explorer, select a project. Use the Code Metrics card in the Project Overview dashboard to get a quick overview of these code metrics:
Number of
                            Files
(Polyspace Bug Finder) (Files)Number of Lines Without Comment(Polyspace Bug Finder) (Uncommented)Cyclomatic Complexity(Polyspace Bug Finder) (Cyclomatic)
If you select a folder in the Project Explorer, the Code Metrics card shows:
The number of Sub Projects in that folder. This number includes only subprojects that are directly (one level) below the top level folder.
An aggregate of the other metrics on the card for all the subprojects at any level for which you are a Contributor, an Owner, or an Administrator.
To open the Code Metrics dashboard, click the Code Metrics icon in the Dashboard section of the toolstrip. Or, click Code Metrics on the card in the Project Overview dashboard.

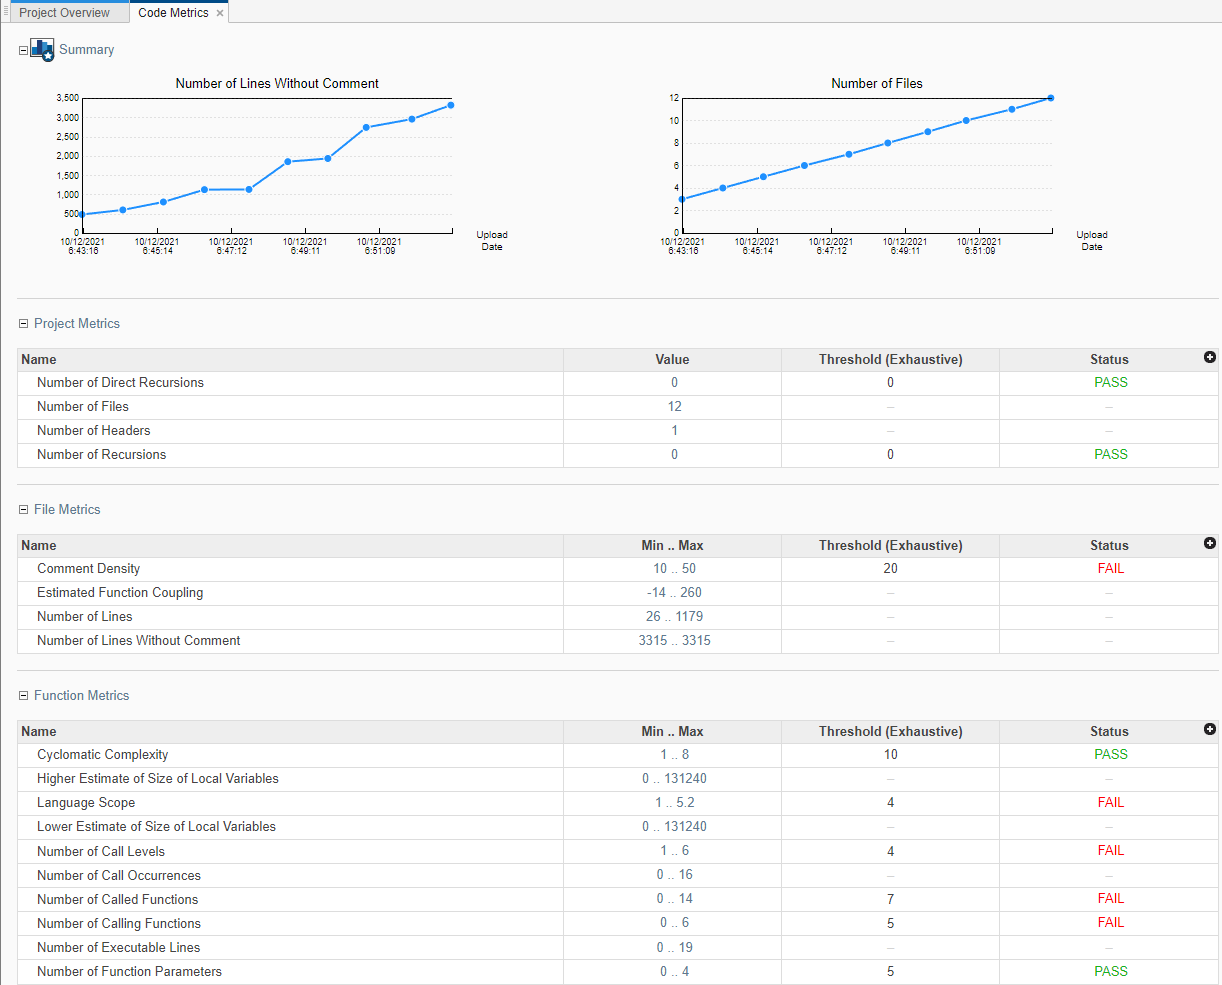
In the Summary section, you see trend charts of the Number of lines Without Comment and Number of Files for the project.
The other sections of the dashboard display tables with the computed value or range of the different project, file, and function metrics. When applicable, the table shows the predefined threshold and pass/fail status for the corresponding code metric. For a list of code complexity metrics thresholds, see HIS Code Complexity Metrics (Polyspace Bug Finder). If you select a folder in the Project Explorer, the tables in the Code Metrics dashboard do not show the threshold or pass/fail status. The value or range of the metrics are aggregate of all subprojects in the selected folder. To drill down to a project from this aggregate view, expand a table row and click the project name.
To improve your code quality, use the pass/fail status to identify and lower metrics values that exceeds a threshold.
For instance, if the Number of Called Functions range exceeds the predefined threshold:
Click FAIL in the Status column or click the range in the Min..Max column to open the Results List filtered to the Number of Called Functions metric
Review the results that exceed the metric threshold. If several of those functions are always called together, you can write one function that fuses the bodies of those functions. Call that one function instead of the group of functions that are called together.