plot
Plot stepped FM pulse waveform
Syntax
Description
plot( plots the real
part of the waveform specified by steppedFMWaveform)steppedFMWaveform.
plot(
plots the waveform with additional options specified by one or more name-value
arguments.steppedFMWaveform,Name=Value)
plot(
specifies the same line color, line style, or marker options as are available in the
MATLAB®
steppedFMWaveform,Name=Value,LineSpec)plot function.
h = plot(___)
Examples
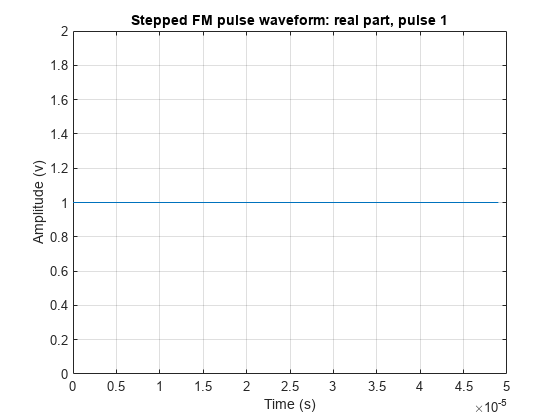
Create and plot a stepped frequency pulse waveform.
 waveform = phased.SteppedFMWaveform(NumSteps=3);
 plot(waveform);
Input Arguments
Name-Value Arguments
Output Arguments
Version History
Introduced in R2011a