shapeFeatures
Description
Examples
Load an X-ray image into the workspace as a medicalImage object. Visualize the image.
data = medicalImage("forearmXrayImage1.dcm");
I = data.Pixels;
figure
imshow(I,[])
Draw two regions of interest (ROI) in the X-ray image. Create masks from the ROIs.
roi1 = drawassisted(Color="g");
roi2 = drawassisted(Color="r");
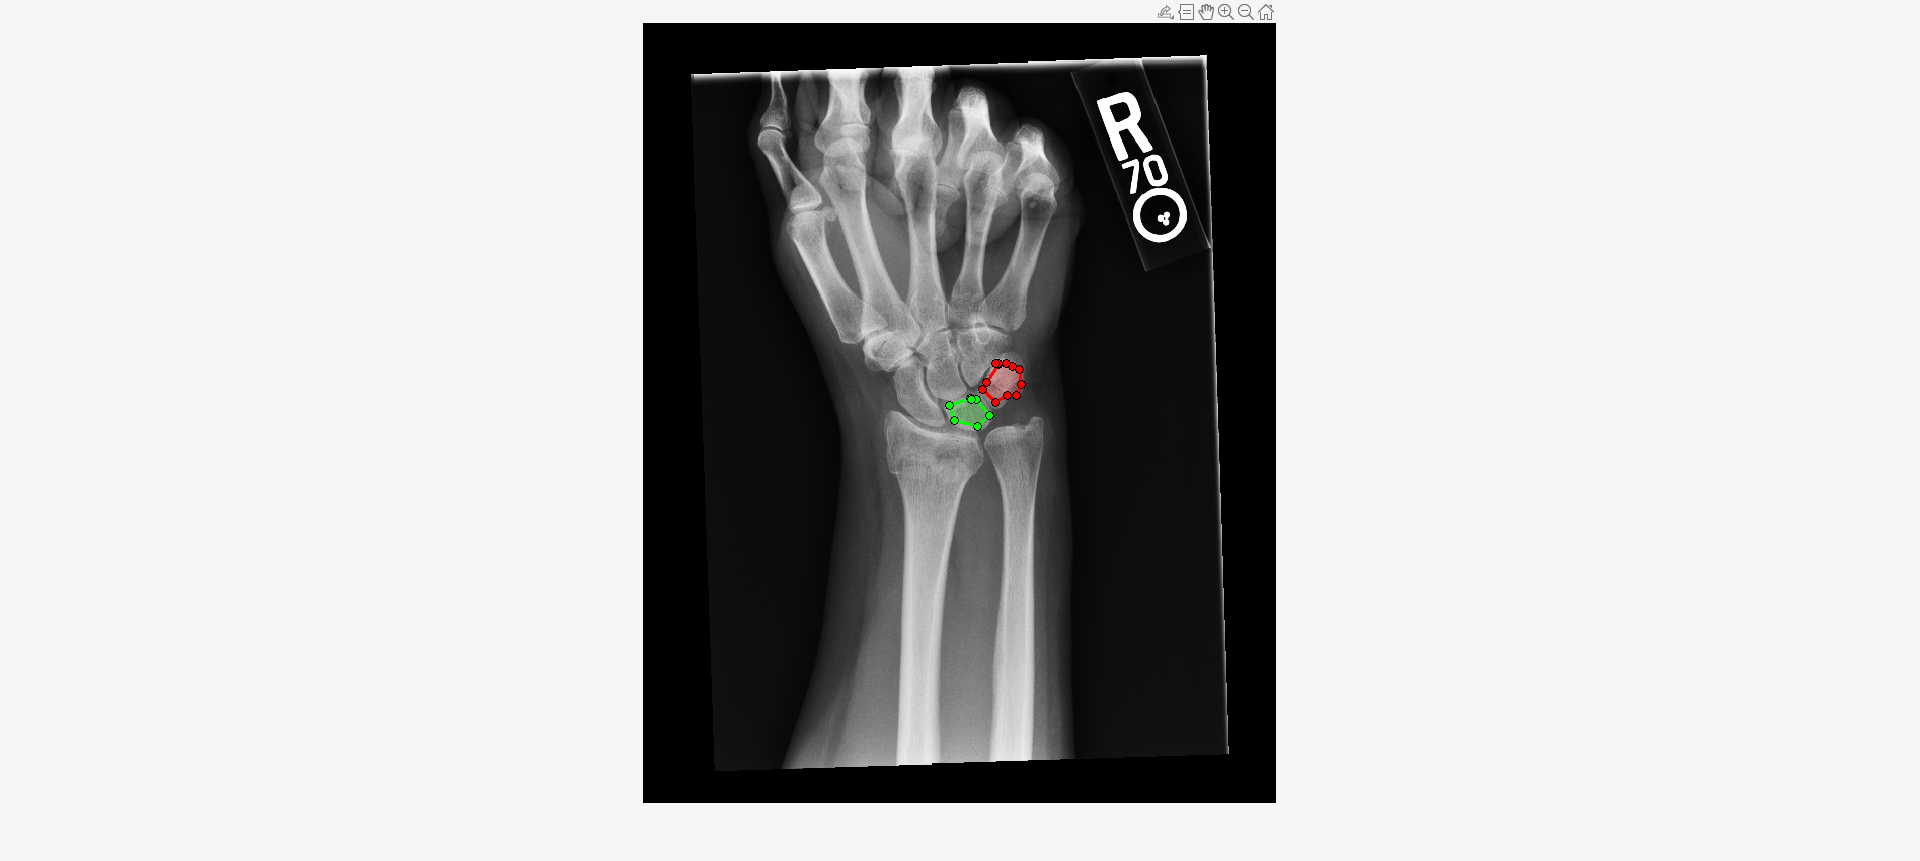
mask1 = createMask(roi1,I);
mask2 = createMask(roi2,I);
Create an ROI label matrix, using different labels for the two ROIs. Create a medicalImage object of the ROI label data.
mask = zeros(size(I));
mask(mask1) = 1;
mask(mask2) = 2;
info = dicominfo("forearmXrayImage1.dcm");
roi = medicalImage(mask,info);
Create a radiomics object from the X-ray image data and ROI label data.
R = radiomics(data,roi)
R =
  radiomics with properties:

                             Data: [1×1 medicalImage]
                         ROILabel: [1×1 medicalImage]
                         Resample: 0
                        Resegment: 1
                       Discretize: 1
                    DiscretizeIVH: 1
            ResampledVoxelSpacing: []
               DataResampleMethod: []
               MaskResampleMethod: []
              ResegmentationRange: []
                  ExcludeOutliers: 1
       DiscreteBinSizeOrBinNumber: []
                   DiscreteMethod: 'FixedBinNumber'
    DiscreteIVHBinSizeOrBinNumber: []
                DiscreteIVHMethod: 'FixedBinNumber'
Compute shape features for both ROIs.
S = shapeFeatures(R)
S=2×24 table
    "1"    54    54.4273    135.8429    2.5156    0.0192    0.1316    1.9662    0.5086    0.9662    0.1857    11.3274    10.1881    6.9240    0    0.6796    0    0.6318    0.6516    NaN    0.9189    0.9818    0.9904    1.2498e+05
    "2"    74    74.8496    181.5963    2.4540    0.0171    0.1034    2.1304    0.4694    1.1304    0.2485    11.5629    11.1870    8.7535    0    0.7825    0    0.6460    0.6678    NaN    0.8386    0.9367    0.9552    1.8045e+05
Import a computed tomography (CT) image volume and the corresponding ROI mask volume from the IBSI validation data set [1][2][3] as medicalVolume objects.
unzip("CTImageMaskNIfTI.zip")
data = medicalVolume("CT_image.nii.gz");
roi = medicalVolume("CT_mask.nii.gz");
Visualize a slice of the CT image volume and the corresponding ROI.
figure
imshowpair(data.Voxels(:,:,20),roi.Voxels(:,:,20),"montage")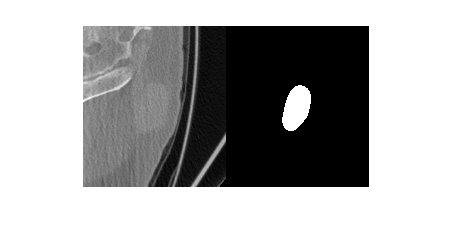
Create a radiomics object, using the CT image volume and ROI mask volume, with default preprocessing options.
R = radiomics(data,roi)
R =
  radiomics with properties:

                             Data: [1×1 medicalVolume]
                         ROILabel: [1×1 medicalVolume]
                         Resample: 1
                        Resegment: 1
                       Discretize: 1
                    DiscretizeIVH: 1
            ResampledVoxelSpacing: 1
               DataResampleMethod: 'linear'
               MaskResampleMethod: 'linear'
              ResegmentationRange: []
                  ExcludeOutliers: 1
       DiscreteBinSizeOrBinNumber: []
                   DiscreteMethod: 'FixedBinNumber'
    DiscreteIVHBinSizeOrBinNumber: []
                DiscreteIVHMethod: 'FixedBinNumber'
Compute the shape features of the ROI in both the 2-D resampled and 3-D resampled CT image volumes.
S = shapeFeatures(R,Type="all",SubType="all")
S=1×51 table
    LabelID    VolumeMesh2D    VolumeVoxelCount2D    SurfaceAreaMesh2D    SurfaceVolumeRatio2D    Compactness1_2D    Compactness2_2D    SphericalDisproportion2D    Sphericity2D    Asphericity2D    CentreOfMassShift2D    Maximum3dDiameter2D    MajorAxisLength2D    MinorAxisLength2D    LeastAxisLength2D    Elongation2D    Flatness2D    VolumeDensityAABB_2D    AreaDensityAABB_2D    VolumeDensityAEE_2D    AreaDensityAEE_2D    VolumeDensityConvexHull2D    AreaDensityConvexHull2D    IntegratedIntensity2D    MoransIIndex2D    GearysCMeasure2D    VolumeMesh3D    VolumeVoxelCount3D    SurfaceAreaMesh3D    SurfaceVolumeRatio3D    Compactness1_3D    Compactness2_3D    SphericalDisproportion3D    Sphericity3D    Asphericity3D    CentreOfMassShift3D    Maximum3dDiameter3D    MajorAxisLength3D    MinorAxisLength3D    LeastAxisLength3D    Elongation3D    Flatness3D    VolumeDensityAABB_3D    AreaDensityAABB_3D    VolumeDensityAEE_3D    AreaDensityAEE_3D    VolumeDensityConvexHull3D    AreaDensityConvexHull3D    IntegratedIntensity3D    MoransIIndex3D    GearysCMeasure3D
    _______    ____________    __________________    _________________    ____________________    _______________    _______________    ________________________    ____________    _____________    ___________________    ___________________    _________________    _________________    _________________    ____________    __________    ____________________    __________________    ___________________    _________________    _________________________    _______________________    _____________________    ______________    ________________    ____________    __________________    _________________    ____________________    _______________    _______________    ________________________    ____________    _____________    ___________________    ___________________    _________________    _________________    _________________    ____________    __________    ____________________    __________________    ___________________    _________________    _________________________    _______________________    _____________________    ______________    ________________

      "1"         52504              52637                8411.4                 0.1602              0.038399            0.52389                 1.2405               0.80615          0.24047             0.91477                56.989                50.304                 44                 33.402            0.87467         0.664             0.47158                0.59688                1.3563                1.4179                   0.90243                     1.1059                  3.1173e+06             0.013525           0.97867            52923              52975                 8425                 0.15919              0.038611            0.5297                  1.2359               0.80911          0.23592             0.8888                 57.359                50.405                44.1                33.518             0.8749        0.66497            0.46924                0.59248                1.3566                1.4135                   0.89714                     1.0994                  3.1069e+06             0.016362           0.96493
[1] Vallières, Martin, Carolyn R. Freeman, Sonia R. Skamene, and Issam El Naqa. “A Radiomics Model from Joint FDG-PET and MRI Texture Features for the Prediction of Lung Metastases in Soft-Tissue Sarcomas of the Extremities.” The Cancer Imaging Archive, 2015. https://doi.org/10.7937/K9/TCIA.2015.7GO2GSKS.
[2] Vallières, M, C R Freeman, S R Skamene, and I El Naqa. “A Radiomics Model from Joint FDG-PET and MRI Texture Features for the Prediction of Lung Metastases in Soft-Tissue Sarcomas of the Extremities.” Physics in Medicine and Biology 60, no. 14 (July 7, 2015): 5471–96. https://doi.org/10.1088/0031-9155/60/14/5471.
[3] Clark, Kenneth, Bruce Vendt, Kirk Smith, John Freymann, Justin Kirby, Paul Koppel, Stephen Moore, et al. “The Cancer Imaging Archive (TCIA): Maintaining and Operating a Public Information Repository.” Journal of Digital Imaging 26, no. 6 (December 2013): 1045–57. https://doi.org/10.1007/s10278-013-9622-7.