Point-by-Point Model Tradeoffs
There are two types of tradeoff that you can add to your session, a tradeoff of independent models, or a tradeoff of interconnected models: a point-by-point model (or multimodel) tradeoff.
A point-by-point model tradeoff is a specially built collection of models from the Model Browser.
You can build a series of models so that each operating point has a model associated with it. In the Model Browser, you can export models for a point-by-point model tradeoff from the test plan node. The models must be two-stage and must have exactly two global inputs. You can use the point-by-point test plan template to create these models.
Follow this procedure to use a point-by-point model tradeoff to calibrate:
Import your model and create tables from your point-by-point model.
Calibrate the tables.
Export your calibration.
The point-by-point model is only defined for certain cells in the tradeoff tables. These
are the operating points that were modeled using the Model Browser part of the toolbox.
These cells have model icons in the table. At each of these operating points, you can use
the model to trade off, and by doing this you can adjust the value in the table. The
point-by-point model is not defined for all other cells in the table and so you cannot use
models to tradeoff. You can edit these cells and they can be filled by extrapolation. You
trade off values at each of the model operating points in exactly the same way as when using
independent models. When you have determined table values at each of the model operating
points, you can fill the whole table by extrapolation by clicking
![]() .
.
Adding a Point-by-Point Model Tradeoff
The simplest way to create your point-by-point tradeoff is to:
Import your model into CAGE.
Create tables from your point-by-point model.
When you click OK, CAGE creates all the tables for the multimodel tradeoff, with breakpoints at the values you have selected.
Calibrating Using a Point-by-Point Model Tradeoff
Each editable operating point in your tables has a model icon in the cell, like this example cell.
![]()
These cells have a model defined at that point. You use the display of these models to help you trade off values at these points to fulfill your aims in exactly the same way as when using independent models in "ordinary" tradeoff mode.
Change input values by dragging the red lines on the graphs or by typing directly into the edit boxes above the graphs. Use the context menu, toolbar or Inputs menu to find the maximum, minimum, or turning point of a model if appropriate.
Look at the model evaluation values (to the left of each row of graphs) and the input variable values (in the edit boxes below the graphs) to see if they meet your requirements.
Remember that the green highlighted graphs indicate how the selected table is filled: if a row is green, the model evaluation value (to the left) fills the table at that operating point; if a column is green, the input variable value (in the edit box below) fills the table.
See the example following; the SPK column of graphs is green, so the value of SPK in the edit box is entered in the table when you click the Apply Lookup Table Filling Values button (
 ).
).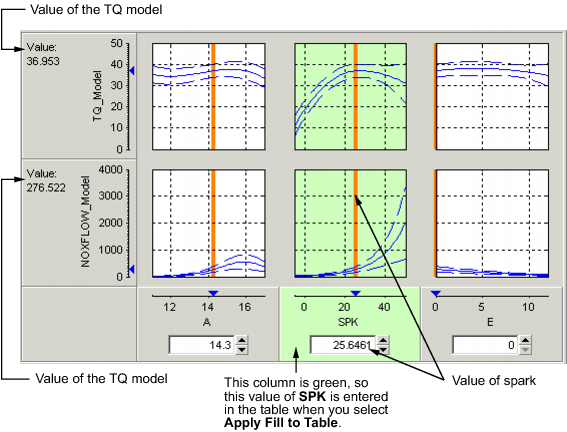
When you are satisfied with the tradeoff given by the value of your variable at this operating point, you apply this value to the table by pressing Ctrl+T, selecting Tables -> Apply Fill to Table, or clicking
in the toolbar.When you have determined table values at each of the model operating points, you can fill the whole table by extrapolation by clicking
 .
.