subtitle
Add subtitle to plot
Description
subtitle(___, sets
properties on the text object using one or more name-value pair arguments. Specify the
properties after all other input arguments. For a list of properties, see Text Properties.Name,Value)
subtitle( specifies the
target object for the subtitle. The target object can be any type of axes, a tiled chart
layout, or an array of objects. Specify the target object before all other input
arguments.target,___)
t = subtitle(___) returns the text object for the
subtitle. Use t to set properties on the object after creating the
subtitle. For a list of properties, see Text Properties.
Examples
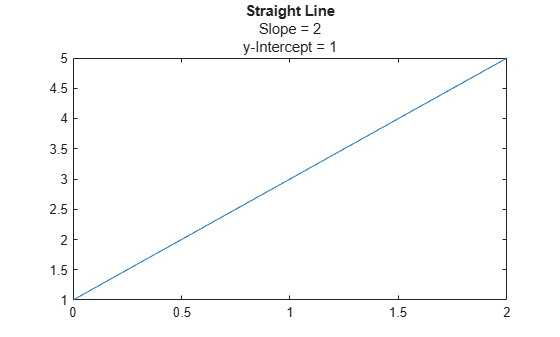
Create a plot. Add a title with the title function. Then add a subtitle with the subtitle function.
plot([0 2],[1 5])
title('Straight Line')
subtitle('Slope = 2, y-Intercept = 1')

Create a plot, and add a title to the plot. Define slopevalue and yintercept as numeric variables. Define txt as a combination of literal text and the values of slopevalue and yintercept converted to character vectors. Then, pass txt to the subtitle function to display the subtitle.
plot([0 2],[1 5])
title('Straight Line')
slopevalue = 4;
yintercept = 1;
txt = ['Slope = ' int2str(slopevalue) ', y-Intercept = ' int2str(yintercept)];
subtitle(txt)

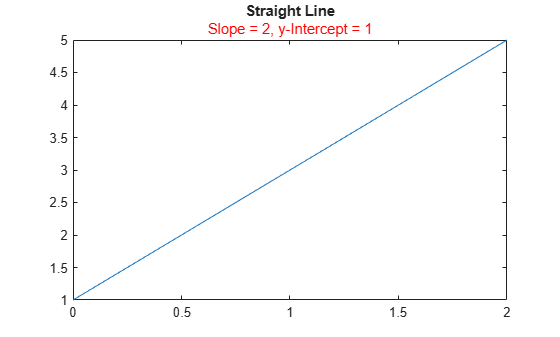
Create a plot. Add a title with the title function. Then, call the subtitle function, and specify the color using the 'Color' name-value pair argument. The color can be a color name, such as 'red', or you can specify a custom color using an RGB triplet or hexadecimal color code. In this case, specify 'red'.
plot([0 2],[1 5])
title('Straight Line')
subtitle('Slope = 2, y-Intercept = 1','Color','red')
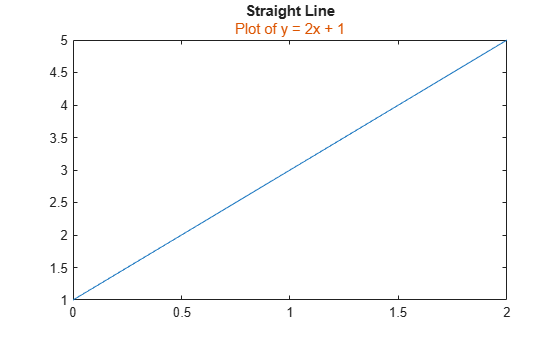
Alternatively, call the subtitle function with an output argument to return the text object. Then set the color on the text object. In this case, specify the hexadecimal color code '#DD5500'.
txt = subtitle('Plot of y = 2x + 1');
txt.Color = '#DD5500';
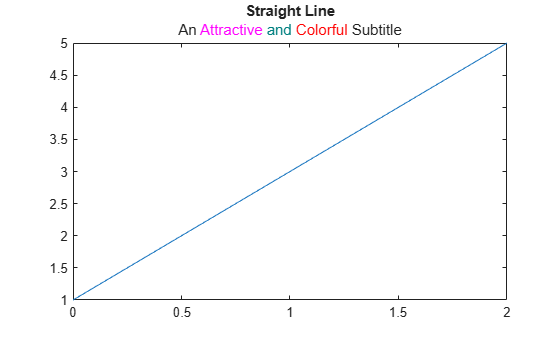
Create a plot, and add a title with the title function. Create a character vector containing TeX markup with custom colors for different words in the subtitle. Then pass the character vector to the subtitle function.
plot([0 2],[1 5])
title('Straight Line')
txt = ['An {\color{magenta}Attractive '...
'\color[rgb]{0 .5 .5}and \color{red}Colorful} Subtitle'];
subtitle(txt)
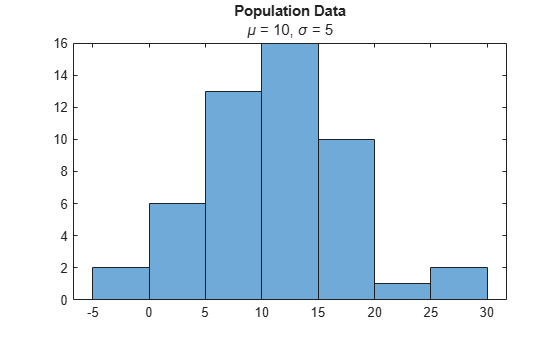
Create a histogram, and add a title with the title function. Create a character vector containing TeX markup with Greek symbols. Then pass the character vector to the subtitle function.
histogram(5*randn(1,50)+10)
title('Population Data')
txt = '{\it\mu} = 10, {\it\sigma} = 5';
subtitle(txt)
Create a histogram, and add a title with the title function. Create a character vector containing TeX markup that displays subscripts and superscripts. Then pass the character vector to the subtitle function.
x = -10:0.1:10;
y1 = x.^2;
y2 = 2*x.^2;
plot(x,y1,x,y2);
title('Exponential Functions')
txt = 'y_1 = x^2 and y_2 = 2x^{2 + k}';
subtitle(txt)
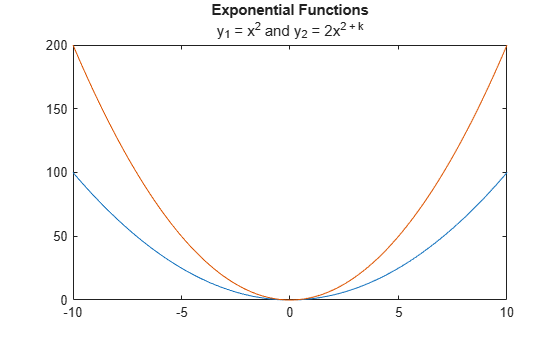
To display an italic font for the variables, add the \it modifier.
txt = '{\ity}_1 = {\itx}^2 and {\ity}_2 = 2{\itx}^{2 + \itk}';
subtitle(txt)
Create a plot, and add a title with the title function. Then create a subtitle containing two lines of text by passing a cell array of character vectors to the subtitle function. Each element in the array is a separate line of text.
plot([0 2],[1 5])
title('Straight Line')
txt = {'Slope = 2','y-Intercept = 1'};
subtitle(txt)
Create a plot with a title. Then create a subtitle containing an underscore character that the TeX interpreter normally uses for subscripts. Set the Interpreter to 'none' when you call the subtitle function, so that the underscore character appears in the subtitle.
plot([0 2],[1 5])
title('Straight Line')
subtitle('y_1 = 2x + 1','Interpreter','none')

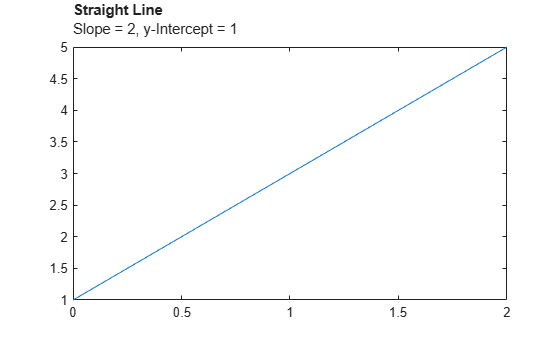
Create a plot and add a title and a subtitle. Get the current axes, and align the title and subtitle to the left edge of the plot box by setting the TitleHorizontalAlignment property on the axes to 'left'.
plot([0 2],[1 5])
title('Straight Line')
subtitle('Slope = 2, y-Intercept = 1')
ax = gca;
ax.TitleHorizontalAlignment = 'left';
Center the title and subtitle by setting the TitleHorizontalAlignment property on the axes to 'center'.
ax.TitleHorizontalAlignment = 'center';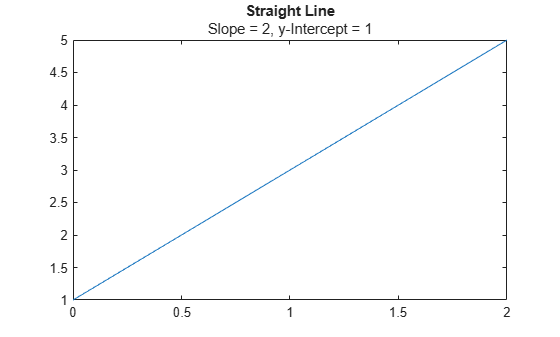
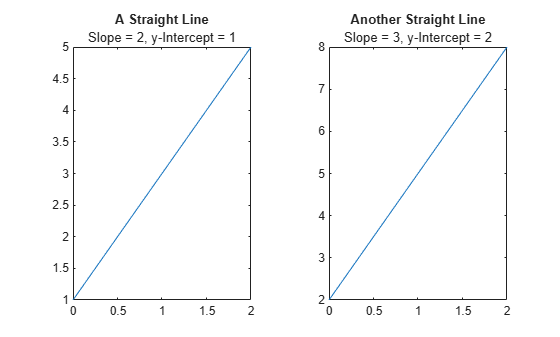
Create two plots in a tiled chart layout. Then add a title and subtitle to each plot.
t = tiledlayout(1,2);

% Left plot
ax1 = nexttile;
plot([0 2],[1 5])
title(ax1,'A Straight Line')
subtitle(ax1,'Slope = 2, y-Intercept = 1')

% Right plot
ax2 = nexttile;
plot([0 2],[2 8])
title(ax2,'Another Straight Line')
subtitle(ax2,'Slope = 3, y-Intercept = 2')
Input Arguments
Name-Value Arguments
Tips
By default, the
Interactionsproperty containseditInteractionso the text can be edited by clicking on the text. To disable this interaction, set theInteractionsproperty of the text object to[].
Version History
Introduced in R2020b