highlight
Highlight nodes and edges in plotted graph
Description
highlight(
highlights the nodes and edges of graph H,G)G by increasing their
node marker size and edge line width, respectively. G must have
the same nodes and a subset of the edges of the underlying graph of
H. If G contains repeated edges, then they
are all highlighted. Isolated nodes with degree 0 are not highlighted.
highlight(___,
uses additional options specified by one or more Name-Value pair arguments using any
of the input argument combinations in previous syntaxes. For example,
Name,Value)highlight(H,nodes,'NodeColor','g') highlights a subset of
nodes by changing their color to green, instead of increasing their marker
size.
Examples
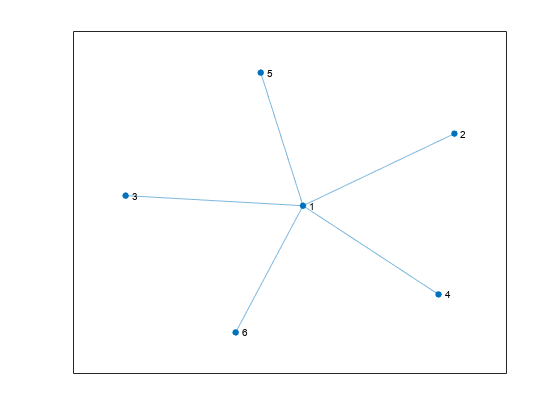
Create and plot a graph. Return a handle to the GraphPlot object, h.
s = 1;
t = 2:6;
G = graph(s,t);
h = plot(G,'Layout','force')
h =
  GraphPlot with properties:

     NodeColor: [0.0660 0.4430 0.7450]
    MarkerSize: 4
        Marker: 'o'
     EdgeColor: [0.0660 0.4430 0.7450]
     LineWidth: 0.5000
     LineStyle: '-'
     NodeLabel: {'1'  '2'  '3'  '4'  '5'  '6'}
     EdgeLabel: {}
         XData: [-5.4192e-04 -1.4527 0.5499 0.5585 1.7918 -1.4469]
         YData: [-9.8846e-06 -1.0480 -1.7042 1.7017 -0.0045 1.0550]
         ZData: [0 0 0 0 0 0]

  Show all properties
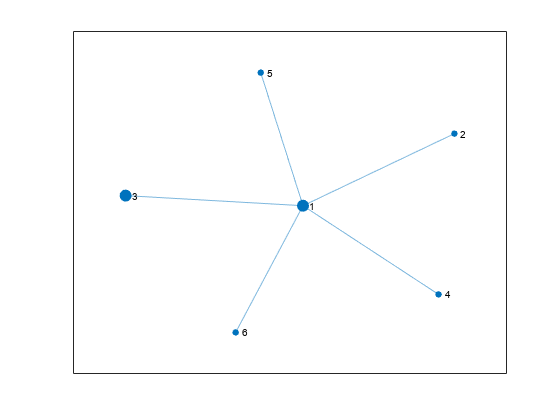
Highlight nodes 1 and 3 by increasing their marker size.
highlight(h,[1 3])
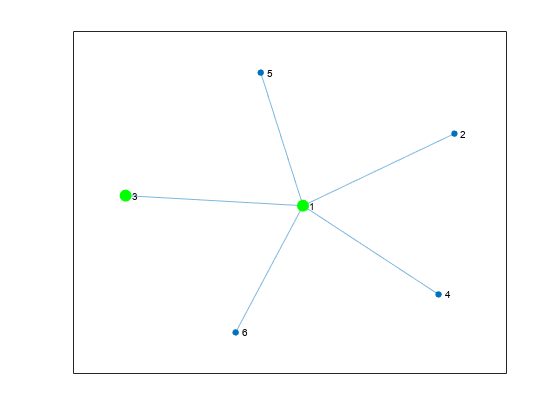
Highlight nodes 1 and 3 by changing their color.
highlight(h,[1 3],'NodeColor','g')
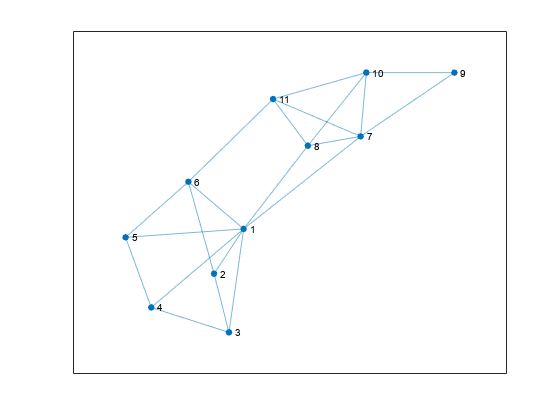
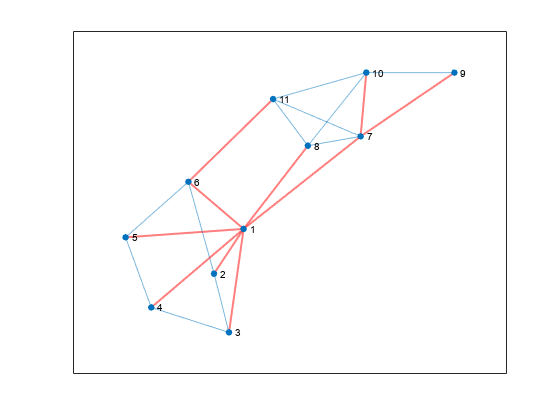
Create and plot a graph. Return a handle to the GraphPlot object, h.
s = [1 1 1 1 1 1 2 3 4 5 6 7 7 7 7 8 9 10 11 8 6];
t = [2 3 4 5 6 7 3 4 5 6 2 8 9 10 11 10 10 11 8 1 11];
G = graph(s,t);
h = plot(G)
h =
  GraphPlot with properties:

     NodeColor: [0.0660 0.4430 0.7450]
    MarkerSize: 4
        Marker: 'o'
     EdgeColor: [0.0660 0.4430 0.7450]
     LineWidth: 0.5000
     LineStyle: '-'
     NodeLabel: {'1'  '2'  '3'  '4'  '5'  '6'  '7'  '8'  '9'  '10'  '11'}
     EdgeLabel: {}
         XData: [-0.2157 -0.5149 -0.3637 -1.1504 -1.4097 -0.7742 0.9685 0.4346 1.9173 1.0259 0.0823]
         YData: [-0.4806 -1.0307 -1.7531 -1.4460 -0.5843 0.0987 0.6570 0.5422 1.4401 1.4411 1.1157]
         ZData: [0 0 0 0 0 0 0 0 0 0 0]

  Show all properties
Calculate the minimum spanning tree of the graph. Highlight the minimum spanning tree subgraph in the plot by increasing the line width and changing the color of the edges in the tree.
[T,p] = minspantree(G);
highlight(h,T,'EdgeColor','r','LineWidth',1.5)
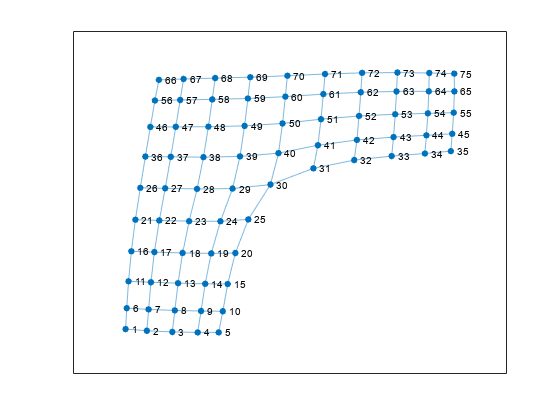
Create and plot a graph. Return a handle to the GraphPlot object, h.
n = 10;
A = delsq(numgrid('L',n+2));
G = graph(A,'omitselfloops');
G.Edges.Weight = ones(numedges(G),1);
h = plot(G);
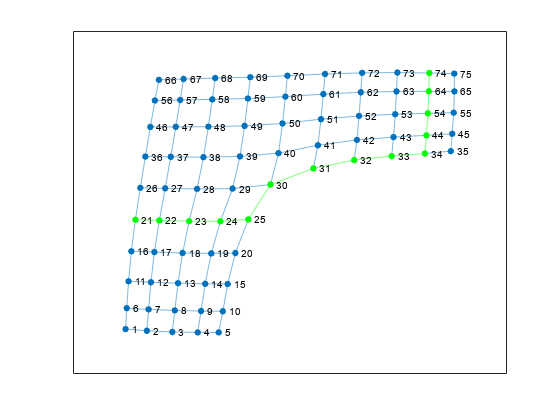
Highlight the shortest path between nodes 74 and 21 by changing the color of the nodes and edges along the path to green.
path = shortestpath(G,74,21);
highlight(h,path,'NodeColor','g','EdgeColor','g')
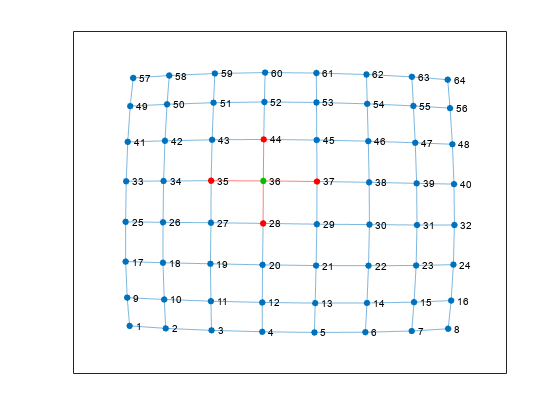
Create a graph representing a square grid with a side of 8 nodes. Plot the graph and return a handle to the GraphPlot object, p.
n = 8;
A = delsq(numgrid('S',n+2));
G = graph(A,'omitselfloops');
p = plot(G);
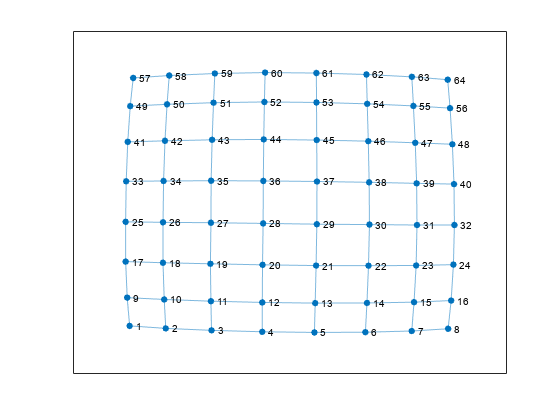
Find the neighbors of node 36.
n36 = neighbors(G,36)
n36 = 4×1

    28
    35
    37
    44
Use highlight to change the color of node 36 to green, and the color of its neighbors and their connecting edges to red.
highlight(p,36,'NodeColor',[0 0.75 0])
highlight(p,n36,'NodeColor','red')
highlight(p,36,n36,'EdgeColor','red')
Create and plot a directed graph. Return a handle to the GraphPlot object, h.
G = digraph(bucky);
h = plot(G);
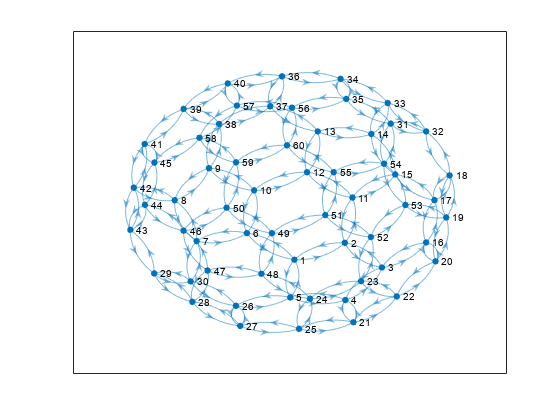
Compute the maximum flow between nodes 1 and 56. Specify two outputs to maxflow to return a directed graph of the nonzero flows, GF.
[mf,GF] = maxflow(G,1,56)
mf =
3
GF =
  digraph with properties:

    Edges: [28×2 table]
    Nodes: [60×0 table]
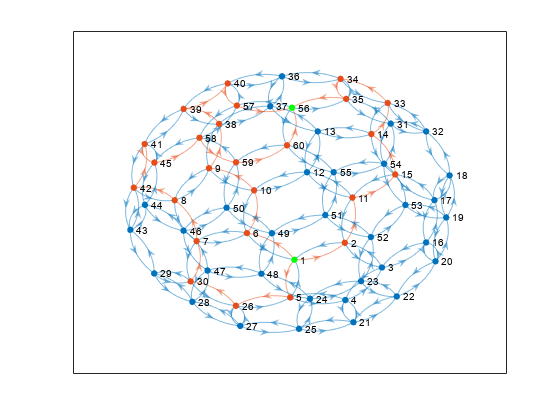
Use highlight to change the color of the edges that contain nonzero flow values. Also change the color of source node 1 and target node 56 to green.
highlight(h,GF,'EdgeColor',[0.9 0.3 0.1],'NodeColor',[0.9 0.3 0.1])
highlight(h,[1 56],'NodeColor','g')
Plot the shortest path between two nodes in a multigraph and highlight the specific edges that are traversed.
Create a weighted multigraph with five nodes. Several pairs of nodes have more than one edge between them. Plot the graph for reference.
G = graph([1 1 1 1 1 2 2 3 3 3 4 4],[2 2 2 2 2 3 4 4 5 5 5 2],[2 4 6 8 10 5 3 1 5 6 8 9]);
p = plot(G,'EdgeLabel',G.Edges.Weight);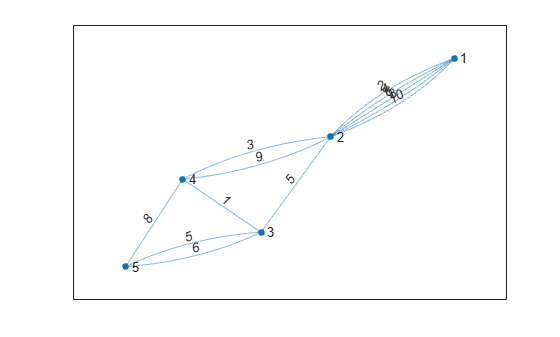
Find the shortest path between node 1 and node 5. Since several of the node pairs have more than one edge between them, specify three outputs to shortestpath to return the specific edges that the shortest path traverses.
[P,d,edgepath] = shortestpath(G,1,5)
P = 1×5

     1     2     4     3     5
d =
11
edgepath = 1×4

     1     7     9    10
The results indicate that the shortest path has a total length of 11 and follows the edges given by G.Edges(edgepath,:).
G.Edges(edgepath,:)
ans=4×2 table
    EndNodes    Weight
    ________    ______

     1    2       2
     2    4       3
     3    4       1
     3    5       5
Highlight this edge path by using the highlight function with the 'Edges' name-value pair to specify the indices of the edges traversed.
highlight(p,'Edges',edgepath)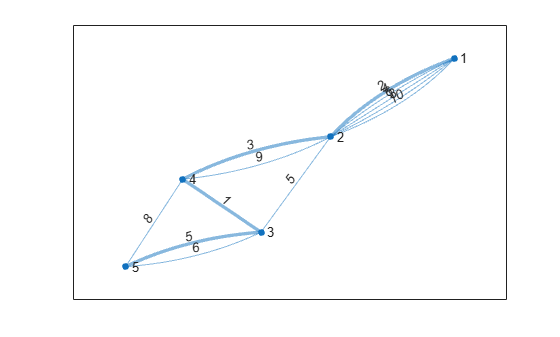
Input Arguments
Name-Value Arguments
Specify optional pairs of arguments as
Name1=Value1,...,NameN=ValueN, where Name is
the argument name and Value is the corresponding value.
Name-value arguments must appear after other arguments, but the order of the
pairs does not matter.
Before R2021a, use commas to separate each name and value, and enclose
Name in quotes.
Example: highlight(H,nodes,'NodeColor','y')
Edges to Highlight
Edge Properties
Edge color, specified as the comma-separated pair consisting of
'EdgeColor' and an RGB triplet, hexadecimal color
code, or color name.
RGB triplets and hexadecimal color codes are useful for specifying custom colors.
An RGB triplet is a three-element row vector whose elements specify the intensities of the red, green, and blue components of the color. The intensities must be in the range
[0,1]; for example,[0.4 0.6 0.7].A hexadecimal color code is a character vector or a string scalar that starts with a hash symbol (
#) followed by three or six hexadecimal digits, which can range from0toF. The values are not case sensitive. Thus, the color codes"#FF8800","#ff8800","#F80", and"#f80"are equivalent.
Alternatively, you can specify some common colors by name. This table lists the named color options, the equivalent RGB triplets, and hexadecimal color codes.
Color Name Short Name RGB Triplet Hexadecimal Color Code Appearance "red""r"[1 0 0]"#FF0000"
"green""g"[0 1 0]"#00FF00"
"blue""b"[0 0 1]"#0000FF"
"cyan""c"[0 1 1]"#00FFFF"
"magenta""m"[1 0 1]"#FF00FF"
"yellow""y"[1 1 0]"#FFFF00"
"black""k"[0 0 0]"#000000"
"white""w"[1 1 1]"#FFFFFF"
This table lists the default color palettes for plots in the light and dark themes.
Palette Palette Colors "gem"— Light theme defaultBefore R2025a: Most plots use these colors by default.

"glow"— Dark theme default
You can get the RGB triplets and hexadecimal color codes for these palettes using the
orderedcolorsandrgb2hexfunctions. For example, get the RGB triplets for the"gem"palette and convert them to hexadecimal color codes.RGB = orderedcolors("gem"); H = rgb2hex(RGB);Before R2023b: Get the RGB triplets using
RGB = get(groot,"FactoryAxesColorOrder").Before R2024a: Get the hexadecimal color codes using
H = compose("#%02X%02X%02X",round(RGB*255)).
Example: plot(G,'EdgeColor','r') creates a graph
plot with red edges.
Line style, specified as the comma-separated pair consisting of
'LineStyle' and one of the line styles listed in
this table.
| Character(s) | Line Style | Resulting Line |
|---|---|---|
'-' | Solid line |
|
'--' | Dashed line |
|
':' | Dotted line |
|
'-.' | Dash-dotted line |
|
'none' | No line | No line |
Edge line width, specified as the comma-separated pair consisting of
'LineWidth' and a positive value in point
units.
Example: 0.75
Arrow size, specified as a positive value in point units. The default
value of ArrowSize is 7 for graphs
with 100 or fewer nodes, and 4 for graphs with more
than 100 nodes.
ArrowSize is used only for directed graphs.
Example: 15
Position of arrow along edge, specified as a value in [0
1]. A value near 0 places arrows closer to the source
node, and a value near 1 places arrows closer to the target node. The
default value is 0.5 so that the arrows are halfway
between the source and target nodes.
ArrowPosition is used only for directed
graphs.
Node Properties
Node color, specified as the comma-separated pair consisting of
'NodeColor' and an RGB triplet, hexadecimal color
code, or color name.
RGB triplets and hexadecimal color codes are useful for specifying custom colors.
An RGB triplet is a three-element row vector whose elements specify the intensities of the red, green, and blue components of the color. The intensities must be in the range
[0,1]; for example,[0.4 0.6 0.7].A hexadecimal color code is a character vector or a string scalar that starts with a hash symbol (
#) followed by three or six hexadecimal digits, which can range from0toF. The values are not case sensitive. Thus, the color codes"#FF8800","#ff8800","#F80", and"#f80"are equivalent.
Alternatively, you can specify some common colors by name. This table lists the named color options, the equivalent RGB triplets, and hexadecimal color codes.
Color Name Short Name RGB Triplet Hexadecimal Color Code Appearance "red""r"[1 0 0]"#FF0000""green""g"[0 1 0]"#00FF00""blue""b"[0 0 1]"#0000FF""cyan""c"[0 1 1]"#00FFFF""magenta""m"[1 0 1]"#FF00FF""yellow""y"[1 1 0]"#FFFF00""black""k"[0 0 0]"#000000""white""w"[1 1 1]"#FFFFFF"This table lists the default color palettes for plots in the light and dark themes.
Palette Palette Colors "gem"— Light theme defaultBefore R2025a: Most plots use these colors by default.
"glow"— Dark theme defaultYou can get the RGB triplets and hexadecimal color codes for these palettes using the
orderedcolorsandrgb2hexfunctions. For example, get the RGB triplets for the"gem"palette and convert them to hexadecimal color codes.RGB = orderedcolors("gem"); H = rgb2hex(RGB);Before R2023b: Get the RGB triplets using
RGB = get(groot,"FactoryAxesColorOrder").Before R2024a: Get the hexadecimal color codes using
H = compose("#%02X%02X%02X",round(RGB*255)).
Example: plot(G,'NodeColor','k') creates a graph
plot with black nodes.
Node marker symbol, specified as the comma-separated pair consisting
of 'Marker' and one of the character vectors listed
in this table. The default is to use circular markers for the graph
nodes.
| Marker | Description | Resulting Marker |
|---|---|---|
"o" | Circle |
|
"+" | Plus sign |
|
"*" | Asterisk |
|
"." | Point |
|
"x" | Cross |
|
"_" | Horizontal line |
|
"|" | Vertical line |
|
"square" | Square |
|
"diamond" | Diamond |
|
"^" | Upward-pointing triangle |
|
"v" | Downward-pointing triangle |
|
">" | Right-pointing triangle |
|
"<" | Left-pointing triangle |
|
"pentagram" | Pentagram |
|
"hexagram" | Hexagram |
|
"none" | No markers | Not applicable |
Example: '+'
Example: 'diamond'
Node marker size, specified as the comma-separated pair consisting of
'MarkerSize' and a positive value in point units.
The default marker size is 4 for graphs with 100 or
fewer nodes, and 2 for graphs with more than 100
nodes.
Example: 10
Node and Edge Labels
Node label color, specified as an RGB triplet, hexadecimal color code, or color name.
RGB triplets and hexadecimal color codes are useful for specifying custom colors.
An RGB triplet is a three-element row vector whose elements specify the intensities of the red, green, and blue components of the color. The intensities must be in the range
[0,1]; for example,[0.4 0.6 0.7].A hexadecimal color code is a character vector or a string scalar that starts with a hash symbol (
#) followed by three or six hexadecimal digits, which can range from0toF. The values are not case sensitive. Thus, the color codes"#FF8800","#ff8800","#F80", and"#f80"are equivalent.
Alternatively, you can specify some common colors by name. This table lists the named color options, the equivalent RGB triplets, and hexadecimal color codes.
| Color Name | Short Name | RGB Triplet | Hexadecimal Color Code | Appearance |
|---|---|---|---|---|
"red" | "r" | [1 0 0] | "#FF0000" |
|
"green" | "g" | [0 1 0] | "#00FF00" |
|
"blue" | "b" | [0 0 1] | "#0000FF" |
|
"cyan"
| "c" | [0 1 1] | "#00FFFF" |
|
"magenta" | "m" | [1 0 1] | "#FF00FF" |
|
"yellow" | "y" | [1 1 0] | "#FFFF00" |
|
"black" | "k" | [0 0 0] | "#000000" |
|
"white" | "w" | [1 1 1] | "#FFFFFF" |
|
This table lists the default color palettes for plots in the light and dark themes.
| Palette | Palette Colors |
|---|---|
Before R2025a: Most plots use these colors by default. |
|
|
|
You can get the RGB triplets and hexadecimal color codes for these palettes using the orderedcolors and rgb2hex functions. For example, get the RGB triplets for the "gem" palette and convert them to hexadecimal color codes.
RGB = orderedcolors("gem");
H = rgb2hex(RGB);
Before R2023b: Get the RGB triplets using RGB =
get(groot,"FactoryAxesColorOrder").
Before R2024a: Get the hexadecimal color codes using H =
compose("#%02X%02X%02X",round(RGB*255)).
Example: plot(G,'NodeLabel',C,'NodeLabelColor','m')
creates a graph plot with magenta node labels.
Edge label color, specified as an RGB triplet, hexadecimal color code, or color name.
RGB triplets and hexadecimal color codes are useful for specifying custom colors.
An RGB triplet is a three-element row vector whose elements specify the intensities of the red, green, and blue components of the color. The intensities must be in the range
[0,1]; for example,[0.4 0.6 0.7].A hexadecimal color code is a character vector or a string scalar that starts with a hash symbol (
#) followed by three or six hexadecimal digits, which can range from0toF. The values are not case sensitive. Thus, the color codes"#FF8800","#ff8800","#F80", and"#f80"are equivalent.
Alternatively, you can specify some common colors by name. This table lists the named color options, the equivalent RGB triplets, and hexadecimal color codes.
| Color Name | Short Name | RGB Triplet | Hexadecimal Color Code | Appearance |
|---|---|---|---|---|
"red" | "r" | [1 0 0] | "#FF0000" |
|
"green" | "g" | [0 1 0] | "#00FF00" |
|
"blue" | "b" | [0 0 1] | "#0000FF" |
|
"cyan"
| "c" | [0 1 1] | "#00FFFF" |
|
"magenta" | "m" | [1 0 1] | "#FF00FF" |
|
"yellow" | "y" | [1 1 0] | "#FFFF00" |
|
"black" | "k" | [0 0 0] | "#000000" |
|
"white" | "w" | [1 1 1] | "#FFFFFF" |
|
This table lists the default color palettes for plots in the light and dark themes.
| Palette | Palette Colors |
|---|---|
Before R2025a: Most plots use these colors by default. |
|
|
|
You can get the RGB triplets and hexadecimal color codes for these palettes using the orderedcolors and rgb2hex functions. For example, get the RGB triplets for the "gem" palette and convert them to hexadecimal color codes.
RGB = orderedcolors("gem");
H = rgb2hex(RGB);
Before R2023b: Get the RGB triplets using RGB =
get(groot,"FactoryAxesColorOrder").
Before R2024a: Get the hexadecimal color codes using H =
compose("#%02X%02X%02X",round(RGB*255)).
Example: plot(G,'EdgeLabel',C,'EdgeLabelColor','m')
creates a graph plot with magenta edge labels.
Font
Version History
Introduced in R2015b