cylinder
Create cylinder
Syntax
Description
Create Cylinder Data
[X,Y,Z] = cylinder returns three
2-by-21 matrices containing the
x-, y-, and z-
coordinates of a cylinder without drawing it. The cylinder has a radius of 1 and
20 equally spaced points around its circumference. The bases are parallel to the
xy-plane.
To draw the cylinder, pass X, Y, and
Z to the surf or
mesh function.
[X,Y,Z] = cylinder( returns the
x-, y-, and z-
coordinates of a cylinder with the specified profile curve,
r)r, and 20 equally spaced points around its
circumference. The function treats each element in r as a
radius at equally spaced heights along the unit height of the cylinder. The size
of each coordinate matrix is m-by-21,
where m=numel(r). However, if r is a
scalar, then m=2.
Plot Cylinders
cylinder(___) plots a cylinder without
returning the coordinates. Use this syntax with any of the input arguments in
previous syntaxes.
cylinder(___,
sets properties of the cylinder plot using one or more name-value arguments. For
example, you can specify the color and transparency of the cylinder. For a list
of properties, see Surface Properties. (since R2024b)Name=Value)
cylinder( plots
into the axes specified by ax,___)ax instead of the current axes.
Specify the axes as the first input argument.
Examples
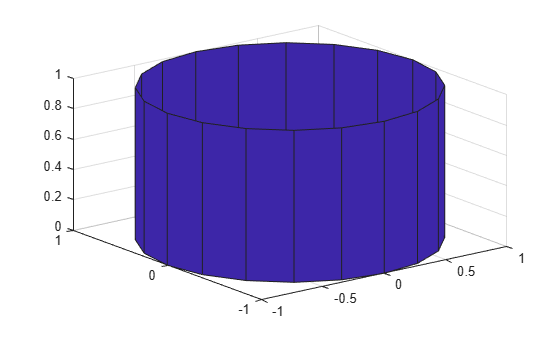
Create and plot a cylinder with a radius equal to 1.
cylinder
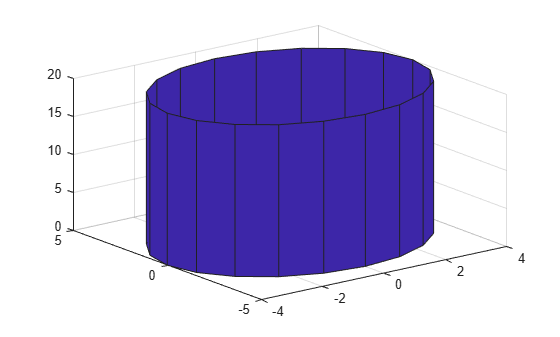
Specify the radius of a cylinder by including the input r. Then, specify the height of the cylinder by modifying the returned Z coordinate.
Define X, Y, and Z as coordinates of a cylinder with a radius of 4.
r = 4;
[X,Y,Z] = cylinder(r);
Specify a height of 20 by modifying the Z coordinate. Plot the cylinder.
h = 20;
Z = Z*h;
surf(X,Y,Z)
Create a cylinder and use the returned coordinates to plot multiple cylinders in different locations.
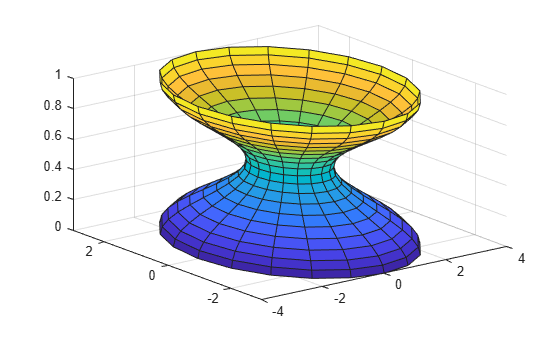
Create a cylinder defined by the profile function 2 + cos(t).
t = 0:pi/10:2*pi;
r = 2 + cos(t);
[X,Y,Z] = cylinder(r);
Plot the cylinder with the base centered at the origin.
surf(X,Y,Z)
Plot two more cylinders on top of the first cylinder.
hold on
surf(X,Y,Z+1)
surf(X,Y,Z+2)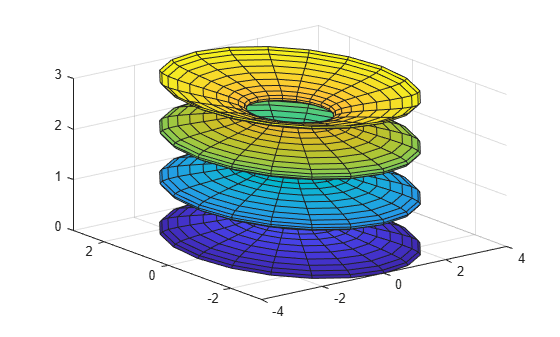
Input Arguments
Name-Value Arguments
Specify optional pairs of arguments as
Name1=Value1,...,NameN=ValueN, where Name is
the argument name and Value is the corresponding value.
Name-value arguments must appear after other arguments, but the order of the
pairs does not matter.
Example: cylinder(4,FaceColor="red") plots a red
cylinder.
Note
The properties listed here are only a subset. For a full list, see Surface Properties.
Face color, specified as one of the values in this table.
| Value | Description |
|---|---|
'flat' | Use a different color for each face based on the values
in the
|
'interp' |
Use interpolated coloring for each face based on the values in the
|
| RGB triplet, hexadecimal color code, or color name |
Use the specified color for all the faces. This option does not use the color
values in the
|
'texturemap' | Transform the color data in CData so that
it conforms to the surface. |
'none' | Do not draw the faces. |
RGB triplets and hexadecimal color codes are useful for specifying custom colors.
An RGB triplet is a three-element row vector whose elements specify the intensities of the red, green, and blue components of the color. The intensities must be in the range
[0,1]; for example,[0.4 0.6 0.7].A hexadecimal color code is a character vector or a string scalar that starts with a hash symbol (
#) followed by three or six hexadecimal digits, which can range from0toF. The values are not case sensitive. Thus, the color codes"#FF8800","#ff8800","#F80", and"#f80"are equivalent.
Alternatively, you can specify some common colors by name. This table lists the named color options, the equivalent RGB triplets, and hexadecimal color codes.
| Color Name | Short Name | RGB Triplet | Hexadecimal Color Code | Appearance |
|---|---|---|---|---|
"red" | "r" | [1 0 0] | "#FF0000" |
|
"green" | "g" | [0 1 0] | "#00FF00" |
|
"blue" | "b" | [0 0 1] | "#0000FF" |
|
"cyan"
| "c" | [0 1 1] | "#00FFFF" |
|
"magenta" | "m" | [1 0 1] | "#FF00FF" |
|
"yellow" | "y" | [1 1 0] | "#FFFF00" |
|
"black" | "k" | [0 0 0] | "#000000" |
|
"white" | "w" | [1 1 1] | "#FFFFFF" |
|
This table lists the default color palettes for plots in the light and dark themes.
| Palette | Palette Colors |
|---|---|
Before R2025a: Most plots use these colors by default. |
|
|
|
You can get the RGB triplets and hexadecimal color codes for these palettes using the orderedcolors and rgb2hex functions. For example, get the RGB triplets for the "gem" palette and convert them to hexadecimal color codes.
RGB = orderedcolors("gem");
H = rgb2hex(RGB);
Before R2023b: Get the RGB triplets using RGB =
get(groot,"FactoryAxesColorOrder").
Before R2024a: Get the hexadecimal color codes using H =
compose("#%02X%02X%02X",round(RGB*255)).
Edge line color, specified as one of the values listed in this table.
| Value | Description |
|---|---|
"none" | Do not draw the edges. |
"flat" | Use a different color for each edge based on the values in the
|
"interp" | Use interpolated coloring for each edge based on the values in the
|
| RGB triplet, hexadecimal color code, or color name |
Use the specified color for all the edges. This option does not use the color
values in the
|
RGB triplets and hexadecimal color codes are useful for specifying custom colors.
An RGB triplet is a three-element row vector whose elements specify the intensities of the red, green, and blue components of the color. The intensities must be in the range
[0,1]; for example,[0.4 0.6 0.7].A hexadecimal color code is a character vector or a string scalar that starts with a hash symbol (
#) followed by three or six hexadecimal digits, which can range from0toF. The values are not case sensitive. Thus, the color codes"#FF8800","#ff8800","#F80", and"#f80"are equivalent.
Alternatively, you can specify some common colors by name. This table lists the named color options, the equivalent RGB triplets, and hexadecimal color codes.
| Color Name | Short Name | RGB Triplet | Hexadecimal Color Code | Appearance |
|---|---|---|---|---|
"red" | "r" | [1 0 0] | "#FF0000" |
|
"green" | "g" | [0 1 0] | "#00FF00" |
|
"blue" | "b" | [0 0 1] | "#0000FF" |
|
"cyan"
| "c" | [0 1 1] | "#00FFFF" |
|
"magenta" | "m" | [1 0 1] | "#FF00FF" |
|
"yellow" | "y" | [1 1 0] | "#FFFF00" |
|
"black" | "k" | [0 0 0] | "#000000" |
|
"white" | "w" | [1 1 1] | "#FFFFFF" |
|
This table lists the default color palettes for plots in the light and dark themes.
| Palette | Palette Colors |
|---|---|
Before R2025a: Most plots use these colors by default. |
|
|
|
You can get the RGB triplets and hexadecimal color codes for these palettes using the orderedcolors and rgb2hex functions. For example, get the RGB triplets for the "gem" palette and convert them to hexadecimal color codes.
RGB = orderedcolors("gem");
H = rgb2hex(RGB);
Before R2023b: Get the RGB triplets using RGB =
get(groot,"FactoryAxesColorOrder").
Before R2024a: Get the hexadecimal color codes using H =
compose("#%02X%02X%02X",round(RGB*255)).