compassplot
Syntax
Description
Vector and Matrix Data
compassplot( plots arrows
(vectors) originating at the origin in polar coordinates. The theta,rho)theta
values control the arrow directions in radians. The rho values control
the arrow magnitudes as radius values.
To plot one set of arrows, specify
thetaandrhoas vectors of equal length.To plot multiple sets of arrows, specify
thetaorrhoas a matrix, or both as matrices of the same size.
Table Data
compassplot(
plots the variables tbl,thetavar,rhovar)thetavar and rhovar from the
table tbl. To plot one set of arrows, specify one variable each for
thetavar and rhovar. To plot multiple sets of
arrows, specify multiple variables for thetavar,
rhovar, or both.
Additional Options
compassplot( displays
the compass plot in the target polar axes pax,___)pax. Specify the polar axes
as the first argument in any of the previous syntaxes.
compassplot(___,
specifies Name=Value)PolarCompassPlot properties using one or more name-value
arguments. Specify the name-value arguments after all other input arguments. For a list of
properties, see PolarCompassPlot Properties.
cp = compassplot(___) returns the
PolarCompassPlot object. Use cp to get and set
properties of the plot after creating it. For a list of properties, see PolarCompassPlot Properties.
Examples
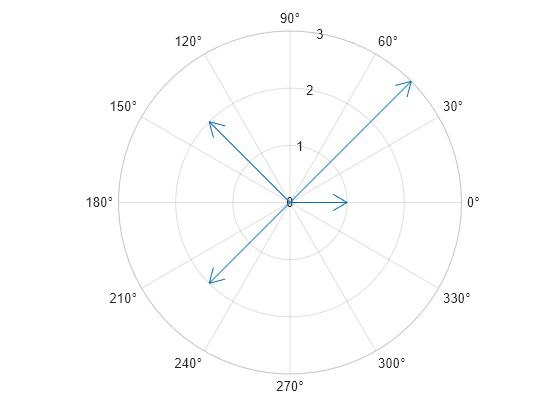
Create the vectors theta and rho, and plot their values in a compass plot.
rho = [1 3 2 2];
theta = [0 pi/4 3*pi/4 5*pi/4];
compassplot(theta,rho)
Change the display of the theta-axis tick labels to show radian values by getting the polar axes and setting the ThetaAxisUnits property to "radians".
pax = gca;
pax.ThetaAxisUnits = "radians";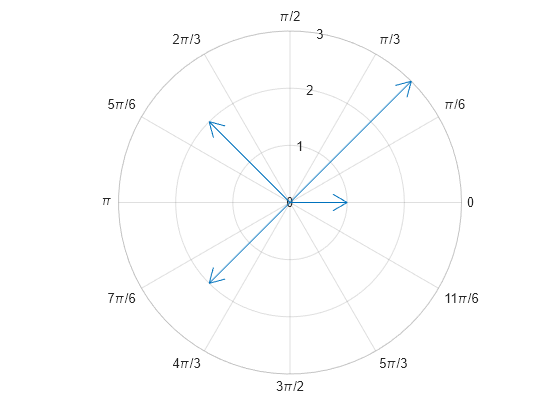
To plot multiple sets of arrows, specify at least one set of coordinates as a matrix. Alternatively, you can call the hold function between plotting commands.
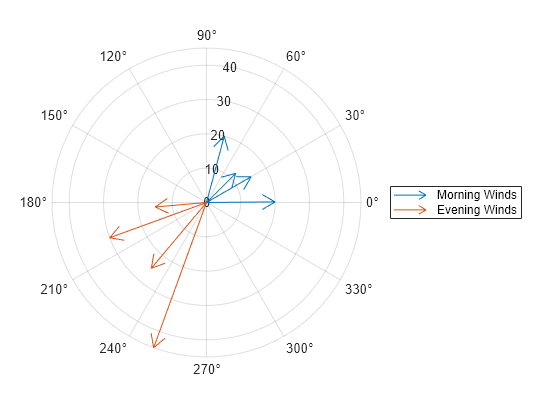
Create a 4-by-2 matrix of wind direction values and a 4-by-2 matrix of wind speed values. The first column in each matrix corresponds to the morning data, and the second column corresponds to the evening data. Plot the data as a compass plot with a legend.
windDirection = deg2rad([0.5 185; 30 200; 45 230; 75 250]);
windSpeed = [20 15; 15 30; 12 25; 20 45];
compassplot(windDirection,windSpeed)
legend(["Morning Winds" "Evening Winds"])
Alternatively, you can plot one set of arrows at a time and call the hold function between plotting commands.
% Create figure and data
figure
morningDirection = deg2rad([0.5 30 45 75]);
eveningDirection = deg2rad([185 200 230 250]);
morningSpeed = [20 15 12 20];
eveningSpeed = [15 30 25 45];

% Plot morning and evening data separately
compassplot(morningDirection,morningSpeed)
hold on
compassplot(eveningDirection,eveningSpeed)
hold off
legend(["Morning Winds" "Evening Winds"])

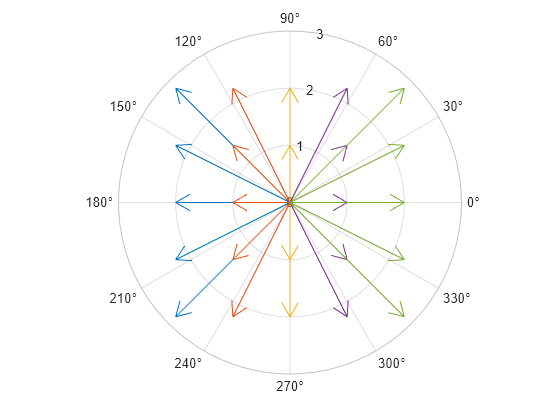
To plot complex values, specify a vector or matrix of complex numbers. For example, create matrices a and b that contain numbers between –2 and 2. Create a matrix Z of complex numbers of the form a+bi and plot them. compassplot plots each column of Z separately with a different color.
[a,b] = meshgrid(-2:2);
Z = a + b*1i;
compassplot(Z)
You can modify aspects of the plot by setting properties. You can set properties by specifying name-value arguments when you call compassplot, or you can set properties later using dot notation.
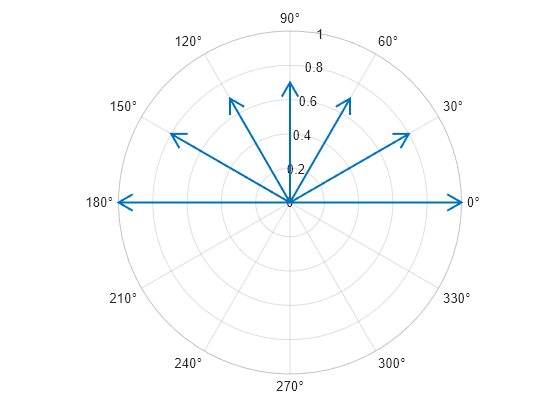
For example, plot seven values, and specify the line thickness by setting the LineWidth name-value argument. Also, specify an output argument to store the PolarCompassPlot object.
theta = 0:pi/6:pi;
rho = [1 0.8 0.7 0.7 0.7 0.8 1];
cp = compassplot(theta,rho,LineWidth=1.5);
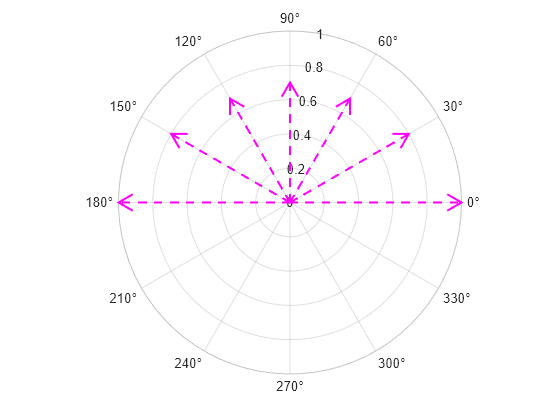
Modify the appearance further by setting properties of the PolarCompassPlot object cp. Change the line color to magenta, and change the line style to a dashed line.
cp.Color = "magenta";
cp.LineStyle = "--";
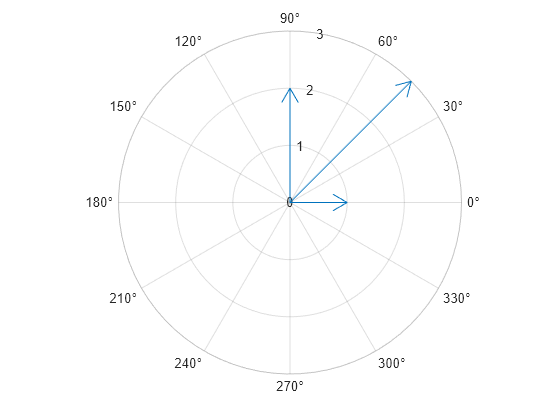
Create a table containing two variables, theta and rho.
theta = [0 pi/4 pi/2]';
rho = [1 3 2]';
t = table(theta,rho);
Create a compass plot from the table.
compassplot(t,"theta","rho")
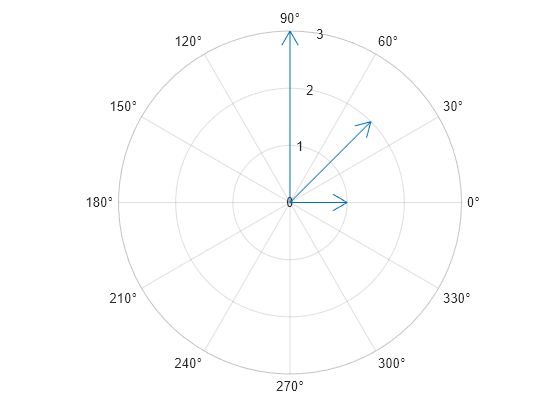
To plot into a specific polar axes object, specify the polar axes as the first argument when you call compassplot. For example, create a polar axes object and plot into it. This strategy is useful in these situations:
You do not want
compassplotto create a new polar axes object.You want to preserve the contents of an existing axes object.
You are creating the plot in an app.
pax = polaraxes;
theta = [0 pi/4 pi/2];
rho = [1 2 3];
compassplot(pax,theta,rho)
Input Arguments
Name-Value Arguments
Specify optional pairs of arguments as
Name1=Value1,...,NameN=ValueN, where Name is
the argument name and Value is the corresponding value.
Name-value arguments must appear after other arguments, but the order of the
pairs does not matter.
Example: compassplot([0 pi/4 pi/2],[1 2 3],LineWidth=1.5) creates a
compass plot using a line width of 1.5 points.
Note
The properties listed here are only a subset. For a full list, see PolarCompassPlot Properties.
Arrow color, specified as an RGB triplet, a hexadecimal color code, a color name, or a short name.
For a custom color, specify an RGB triplet or a hexadecimal color code.
An RGB triplet is a three-element row vector whose elements specify the intensities of the red, green, and blue components of the color. The intensities must be in the range
[0,1], for example,[0.4 0.6 0.7].A hexadecimal color code is a string scalar or character vector that starts with a hash symbol (
#) followed by three or six hexadecimal digits, which can range from0toF. The values are not case sensitive. Therefore, the color codes"#FF8800","#ff8800","#F80", and"#f80"are equivalent.
Alternatively, you can specify some common colors by name. This table lists the named color options, the equivalent RGB triplets, and the hexadecimal color codes.
| Color Name | Short Name | RGB Triplet | Hexadecimal Color Code | Appearance |
|---|---|---|---|---|
"red" | "r" | [1 0 0] | "#FF0000" |
|
"green" | "g" | [0 1 0] | "#00FF00" |
|
"blue" | "b" | [0 0 1] | "#0000FF" |
|
"cyan"
| "c" | [0 1 1] | "#00FFFF" |
|
"magenta" | "m" | [1 0 1] | "#FF00FF" |
|
"yellow" | "y" | [1 1 0] | "#FFFF00" |
|
"black" | "k" | [0 0 0] | "#000000" |
|
"white" | "w" | [1 1 1] | "#FFFFFF" |
|
"none" | Not applicable | Not applicable | Not applicable | No color |
This table lists the default color palettes for plots in the light and dark themes.
| Palette | Palette Colors |
|---|---|
Before R2025a: Most plots use these colors by default. |
|
|
|
You can get the RGB triplets and hexadecimal color codes for these palettes using the orderedcolors and rgb2hex functions. For example, get the RGB triplets for the "gem" palette and convert them to hexadecimal color codes.
RGB = orderedcolors("gem");
H = rgb2hex(RGB);
Before R2023b: Get the RGB triplets using RGB =
get(groot,"FactoryAxesColorOrder").
Before R2024a: Get the hexadecimal color codes using H =
compose("#%02X%02X%02X",round(RGB*255)).
Style of arrow stems, specified as one of the line styles listed in this table.
| Line Style | Description | Resulting Line |
|---|---|---|
"-" | Solid line |
|
"--" | Dashed line |
|
":" | Dotted line |
|
"-." | Dash-dotted line |
|
"none" | No line | No line |
Width of arrow lines, specified as a positive value in point units. One point equals
1/72 inch. The default value is 0.5
point.
Version History
Introduced in R2024b