Specify Line and Marker Appearance in Plots
MATLAB® creates plots using a default set of line styles, colors, and markers.
These defaults provide a clean and consistent look across the different plots you
create. If you want, you can customize these aspects of your plot. Many plotting
functions have an input argument called linespec for customizing.
Also, the objects returned by these functions typically have properties for controlling
these aspects of your plot. The names of the arguments and properties can vary, but the
values they accept typically follow a common pattern. Once you are familiar with the
pattern, you can use it to modify a wide variety of plots.
The following examples use the plot function to demonstrate the
overall approach for customizing the appearance of lines. For a complete list of options
for a specific plotting function, refer to the documentation for that function.
Line Styles
Most line plots display a solid line by default, but you can customize the line with any of the line styles in the following table. For example, create a line plot with a dashed line:
plot([0 1 2 3],'--')| Line Style | Description | Resulting Line |
|---|---|---|
"-" | Solid line |
|
"--" | Dashed line |
|
":" | Dotted line |
|
"-." | Dash-dotted line |
|
Markers
Usually, you can specify a marker symbol in addition to the line style. The markers appear at the data points in your chart. For example, create a line plot with a dashed line and circular markers:
plot([0 1 2 3],'--o')| Marker | Description | Resulting Marker |
|---|---|---|
"o" | Circle |
|
"+" | Plus sign |
|
"*" | Asterisk |
|
"." | Point |
|
"x" | Cross |
|
"_" | Horizontal line |
|
"|" | Vertical line |
|
"square" | Square |
|
"diamond" | Diamond |
|
"^" | Upward-pointing triangle |
|
"v" | Downward-pointing triangle |
|
">" | Right-pointing triangle |
|
"<" | Left-pointing triangle |
|
"pentagram" | Pentagram |
|
"hexagram" | Hexagram |
|
Specify Combinations of Colors, Line Styles, and Markers
Many plotting functions have a single argument for specifying the color, the line style, and the marker. For example, the plot function has an optional linespec argument for specifying one or more of these aspects. (Alternatively, you can set properties to modify the plot after creating it.)
Create a plot with a red dashed line and circular markers by specifying the linespec argument as '--or'. For this combination, '--' corresponds to a dashed line, 'o' corresponds to circular markers, and 'r' corresponds to red.
plot([1 2 3 4 5 6],[0 3 1 6 4 10],'--or')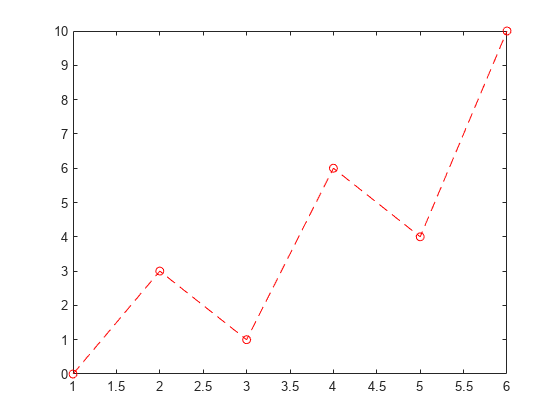
You do not need to specify all three aspects of the line. For example, if you specify only the marker, the plot displays the markers with the default color and no line.
plot([1 2 3 4 5 6],[0 3 1 6 4 10],'o')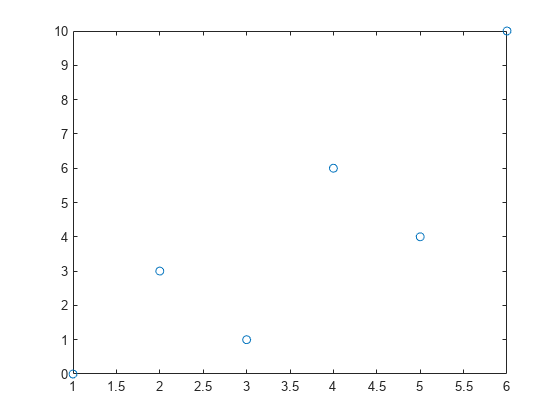
You can use the linespec argument to specify a named color, but to specify a custom color, set an object property. For example, Line objects have a Color property.
Create a plot with a purple line that has circular markers. Specify only the line and marker symbols in the linespec argument. Set the Color property separately as a name-value argument. Return the Line object as p, so you can change other properties later.
p = plot([1 2 3 4 5 6],[0 3 1 6 4 10],'-o','Color',[0.5 0 0.8]);

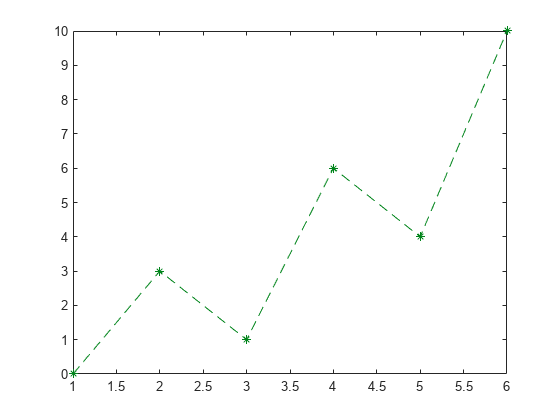
Next, change the color of the line to a shade of green by setting the Color property to the hexadecimal color code '#00841a'. Then change the line style to dashed, and change the markers to asterisks.
Before R2019a, specify the color as an RGB triplet instead of a hexadecimal color code. For example, p.Color = [0 0.52 0.10].
p.Color = '#00841a';
p.LineStyle = '--';
p.Marker = '*';
Modify Line Width, Marker Fill, and Marker Outline
You can modify other aspects of lines by setting properties. For example, Line objects have a LineWidth property for controlling the line's thickness. To create a thicker line, you can specify the LineWidth as a name-value argument when you call the plot function. In this case, set the LineWidth to 3. Return the Line object as p so you can set other properties later.
p = plot([1 2 3 4 5 6],[0 3 1 6 4 10],'-o','LineWidth',3);

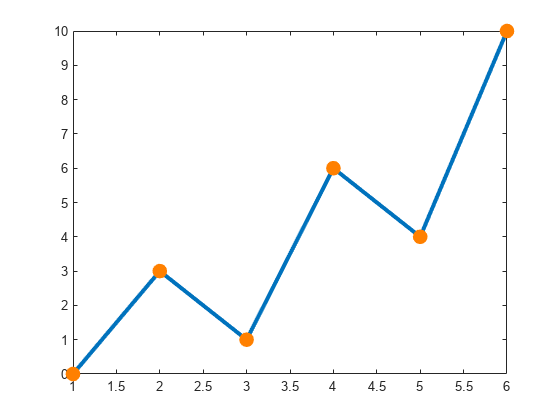
Fill the markers with a shade of orange by setting the MarkerFaceColor property on the Line object. Then increase the marker size to 8 by setting the MarkerSize property.
p.MarkerFaceColor = [1 0.5 0];
p.MarkerSize = 8;

Change the outlines of the markers to match the fill color by setting the MarkerEdgeColor property.
p.MarkerEdgeColor = [1 0.5 0];