geopoint
Geographic point vector
Description
A geopoint vector is a container object that holds geographic point coordinates and attributes. The points are coupled, such that the size of the latitude and longitude coordinate arrays are always equal and match the size of any dynamically added attribute arrays. Each entry of a coordinate pair and associated attributes, if any, represents a discrete element in the geopoint vector.
To create a geographic point shape for use with a geospatial table, create a geopointshape
object instead.
Creation
Syntax
Description
p = geopoint() constructs an empty geopoint vector with
these default property
settings:
p =

 0x1 geopoint vector with properties:

 Collection properties:
     Geometry: 'point'
     Metadata: [1x1 struct]
 Feature properties:
     Latitude: []
Longitude: []p = geopoint(
sets the latitude,longitude)Latitude and Longitude
properties of geopoint vector p
p = geopoint(
sets the latitude,longitude,Name,Value)Latitude and Longitude
properties, then adds dynamic properties to the geopoint vector using
Name,Value argument pairs. You can specify several
name-value pair arguments in any order as
Name1,Value1,...,NameN,ValueN.
p = geopoint( constructs
a new structArray)geopoint vector from the fields of the structure,
structArray.
If
structArraycontains the fieldLat, and does not contain a fieldLatitude, then theLatvalues are assigned to theLatitudeproperty. Similar behavior occurs whenstructArraycontains the fieldLon, and does not contain the fieldLongitude.If
structArraycontains bothLatandLatitudefields, then both field values are assigned top. Similar behavior occurs forLonandLongitudefields when both are present instructArrayOther fields of
structArrayare assigned topand become dynamic properties. Field values instructArraythat are not numeric data types, string scalars, string arrays, character vectors, or cell arrays of numeric data types or character vectors are ignored.
p = geopoint(
sets the latitude,longitude,structArray)Latitude and Longitude
properties, and sets dynamic properties from the field values of the structure,
structArray.
If
structArraycontains the fieldsLat,Latitude,Lon, orLongitude, then those field values are ignored.
Properties
Object Functions
append | Append features to geographic or planar vector |
cat | Concatenate geographic or planar vector |
disp | Display geographic or planar vector |
fieldnames | Return dynamic property names of geographic or planar vector |
isempty | Determine if geographic or planar vector is empty |
isfield | Determine if dynamic property exists in geographic or planar vector |
isprop | Determine if property exists in geographic or planar vector |
length | Return number of elements in geographic or planar vector |
properties | Return property names of geographic or planar vector |
rmfield | Remove dynamic property from geographic or planar vector |
rmprop | Remove property from geographic or planar vector |
size | Return size of geographic or planar vector |
struct | Convert geographic or planar vector to scalar structure |
vertcat | Vertically concatenate geographic or planar vectors |
Examples
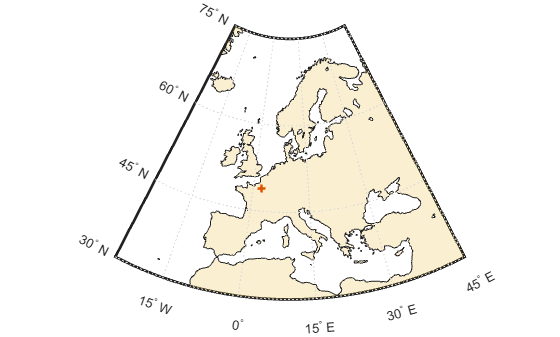
Create a geopoint vector using the latitude and longitude of Paris, France. The geometry of a geopoint vector is always 'point'.
lat = 48.8566;
lon = 2.3522;
p = geopoint(lat,lon)
p =
 1×1 geopoint vector with properties:

 Collection properties:
     Geometry: 'point'
     Metadata: [1×1 struct]
 Feature properties:
     Latitude: 48.8566
    Longitude: 2.3522
Display the point on a map of Europe. You can pass a geopoint vector directly to the geoshow function. The geoshow function reads the coordinates and geometry type from the geopoint vector.
figure
worldmap europe
geoshow("landareas.shp",FaceAlpha=0.2)
geoshow(p,LineWidth=2)
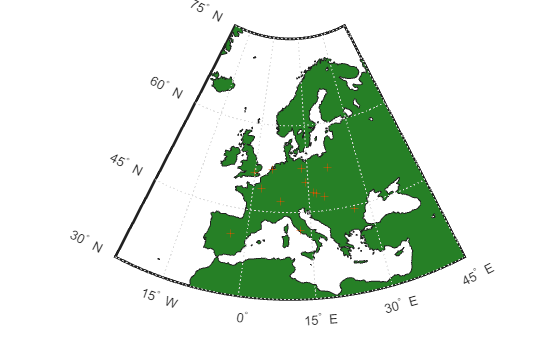
Import data from a text file with the latitudes and longitudes of some European capitals. The latitude coordinates are in the first column and the longitude coordinates are in the second column. The coordinates are separated by single space character.
data = importdata("european_capitals.txt");Create a geopoint vector containing the latitude and longitude data.
p = geopoint(data(:,1),data(:,2));
Plot the points on a map showing the landmass of Europe.
worldmap europe
geoshow("landareas.shp",FaceColor=[0.15 0.5 0.15])
geoshow(p)
Alternatively, you can also plot these points over a map using the geoplot function. This example includes a line specification parameter to specify a plus sign marker and the color red. The example also increases the line width for better visibility of the markers.
figure
geoplot(p.Latitude,p.Longitude,"+r",LineWidth=2)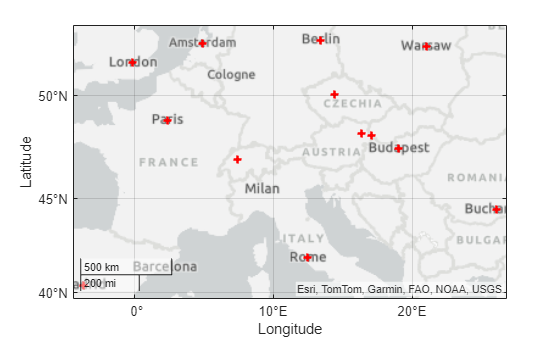
Create a geopoint vector, specifying Latitude,
Longitude, and Temperature, where
Temperature is part of a Name-Value pair.
point = geopoint(42, -72, 'Temperature', 89)point =
1x1 geopoint vector with properties:
Collection properties:
Geometry: 'point'
Metadata: [1x1 struct]
Feature properties:
Latitude: 42
Longitude: -72
Temperature: 89Construct a geopoint object specifying names.
    p = geopoint([51.519 48.871], [-.13 2.4131],...
       'Name', {"London", "Paris"})
p =

 2x1 geopoint vector with properties:

 Collection properties:
     Geometry: 'point'
     Metadata: [1x1 struct]
 Feature properties:
     Latitude: [51.5190 48.8710]
    Longitude: [-0.1300 2.4131]
Name: {'London' 'Paris'}Read shape data into a geostruct (a structure array containing
Lat and Lon fields).
S = shaperead('worldcities.shp', 'UseGeoCoords', true)
S =

318x1 struct array with fields:

    Geometry
    Lon
    Lat
    Name
Create a geopoint vector specifying the geostruct.
p = geopoint(S)
p =

 318x1 geopoint vector with properties:

 Collection properties:
     Geometry: 'point'
     Metadata: [1x1 struct]
 Feature properties:
     Latitude: [1x318 double]
    Longitude: [1x318 double]
         Name: {1x318 cell}
Add a Filename field to the
Metadata structure. The Metadata
property pertains to all elements of a geopoint vector.
p.Metadata.Filename = 'worldcities.shp';
m = p.Metadata
ans =

Filename: 'worldcities.shp'Create a structure array.
[structArray, A] = shaperead('worldcities.shp', 'UseGeoCoords', true)
structArray =

318x1 struct array with fields:
    Geometry
    Lon
    Lat

A =

318x1 struct array with fields:
    Name
Use the numeric arrays and the structure containing the list of names to construct a geopoint vector.
p = geopoint([structArray.Lat], [structArray.Lon], A)
p =

 318x1 geopoint vector with properties:

 Collection properties:
     Geometry: 'point'
     Metadata: [1x1 struct]
 Feature properties:
     Latitude: [1x318 double]
    Longitude: [1x318 double]
Name: {1x318 cell}Generate an empty geopoint vector using the default constructor, then
populate the geopoint vector using dot notation with properties from data
fields in structure structArray.
structArray = shaperead('worldcities.shp', 'UseGeoCoords', true);
p = geopoint();
p.Latitude  = [structArray.Lat];
p.Longitude = [structArray.Lon];
p.Name = structArray.Name;
p
p =

 318x1 geopoint vector with properties:

 Collection properties:
     Geometry: 'point'
     Metadata: [1x1 struct]
 Feature properties:
     Latitude: [1x318 double]
    Longitude: [1x318 double]
Name: {1x318 cell}This example shows how to add new values to an existing geopoint vector. The example appends data about Paderborn Germany to the geopoint vector of data about world cities.
Read world cities data using the shaperead command. shaperead returns a structure array.
structArray = shaperead('worldcities.shp', 'UseGeoCoords', true);
Create a geopoint vector from the structure array. Display the last of the 318 elements in the vector.
p = geopoint(structArray);
p(end)
ans =
 1×1 geopoint vector with properties:

 Collection properties:
     Geometry: 'point'
     Metadata: [1×1 struct]
 Feature properties:
     Latitude: 34.8519
    Longitude: 113.8061
         Name: 'Zhengzhou'
Add the Paderborn data to the end of the geopoint vector. Display the last of the existing elements and the new element.
lat = 51.715254;
lon = 8.75213;
p = append(p, lat, lon, 'Name', 'Paderborn');
p(end-1:end)
ans =
 2×1 geopoint vector with properties:

 Collection properties:
     Geometry: 'point'
     Metadata: [1×1 struct]
 Feature properties:
     Latitude: [34.8519 51.7153]
    Longitude: [113.8061 8.7521]
         Name: {'Zhengzhou'  'Paderborn'}
Another way to add a point at the end of a vector is to use linear indexing. For example, add data about Arlington, Massachusetts to the end of the world cities vector. Notice how, after the initial assignment statement appends a value to the Latitude property vector, using end+1 , all other property vectors automatically expand by one element. Display the last of the existing elements and the new element.
p(end+1).Latitude = 42.417060
p =
 320×1 geopoint vector with properties:

 Collection properties:
     Geometry: 'point'
     Metadata: [1×1 struct]
 Feature properties:
     Latitude: [5.2985 24.6525 5.6106 37.0613 9.0235 -34.6645 12.8767 22.7778 31.3044 36.7870 43.3620 31.7444 31.7744 52.3699 61.6040 39.7831 41.4673 -18.9141 -16.3867 64.7383 38.0316 15.3042 -25.1162 38.0164 33.7657 -36.9126 33.3449 … ] (1×320 double)
    Longitude: [-3.9509 54.7589 -0.2121 35.3894 38.7575 138.8528 44.5408 72.2474 30.4098 3.0397 77.0010 35.9214 75.0498 4.8892 -149.1074 32.9496 122.8003 47.5258 -71.4434 40.6098 58.6638 38.8593 -57.5113 23.5183 -84.3489 174.7379 … ] (1×320 double)
         Name: {1×320 cell}
p(end).Longitude = -71.170200;
p(end).Name = 'Arlington';
p(end-1:end)
ans =
2×1 geopoint vector with properties:
Collection properties:
Geometry: 'point'
Metadata: [1×1 struct]
Feature properties:
Latitude: [51.7153 42.4171]
Longitude: [8.7521 -71.1702]
Name: {'Paderborn' 'Arlington'}
Construct a geopoint vector containing two features and then add two dynamic properties.
lat = [51.519 48.871];
lon = [-.13 2.4131];
p = geopoint(lat, lon);

p.Name = {'London', 'Paris'};   % Add character feature dynamic property
p.ID = [1 2] 			% Add numeric feature dynamic property
p =

 2x1 geopoint vector with properties:

 Collection properties:
     Geometry: 'point'
     Metadata: [1x1 struct]
 Feature properties:
     Latitude: [51.5190 48.8710]
    Longitude: [-0.1300 2.4131]
         Name: {'London' 'Paris'}
           ID: [1 2]
Add the coordinates for a third feature.
p(3).Latitude = 45.472;
p(3).Longitude = 9.184
p =

 3x1 geopoint vector with properties:

 Collection properties:
     Geometry: 'point'
     Metadata: [1x1 struct]
 Feature properties:
     Latitude: [51.5190 48.8710 45.4720]
    Longitude: [-0.1300 2.4131 9.1840]
         Name: {'London' 'Paris' ''}
           ID: [1 2 0]
Note that lengths of all feature properties are synchronized with default values.
Set the values for the ID feature dynamic property with
more values than contained in Latitude or
Longitude.
p.ID = 1:4
p =

 4x1 geopoint vector with properties:

 Collection properties:
     Geometry: 'point'
     Metadata: [1x1 struct]
 Feature properties:
     Latitude: [51.5190 48.8710 45.4720 0]
    Longitude: [-0.1300 2.4131 9.1840 0]
         Name: {'London' 'Paris' '' ''}
           ID: [1 2 3 4]
Note that all feature properties are expanded to match in size.
Set the values for the ID feature dynamic property with fewer values than
contained in the Latitude or Longitude
properties.
p.ID = 1:2
p =

 4x1 geopoint vector with properties:

 Collection properties:
     Geometry: 'point'
     Metadata: [1x1 struct]
 Feature properties:
     Latitude: [51.5190 48.8710 45.4720 0]
    Longitude: [-0.1300 2.4131 9.1840 0]
         Name: {'London' 'Paris' '' ''}
           ID: [1 2 0 0]
The ID property values expand to match the length of
the Latitude and Longitude property
values.
Set the value of either coordinate property (Latitude
or Longitude) with fewer values.
p.Latitude = [51.519 48.871]
p =

 2x1 geopoint vector with properties:

 Collection properties:
     Geometry: 'point'
     Metadata: [1x1 struct]
 Feature properties:
     Latitude: [51.5190 48.8710]
    Longitude: [-0.1300 2.4131]
         Name: {'London' 'Paris'}
           ID: [1 2]
All properties shrink to match in size.
Remove the ID property by setting its value to [
].
p.ID = []
p =

 2x1 geopoint vector with properties:

 Collection properties:
     Geometry: 'point'
     Metadata: [1x1 struct]
 Feature properties:
     Latitude: [51.5190 48.8710]
    Longitude: [-0.1300 2.4131]
         Name: {'London' 'Paris'}
Remove all dynamic properties and set the object to empty by setting a coordinate property value to [ ].
p.Latitude = []
p =

 0x1 geopoint vector with properties:

 Collection properties:
     Geometry: 'point'
     Metadata: [1x1 struct]
 Feature properties:
     Latitude: []
Longitude: []Read a shapefile into the workspace as a structure array. Then, create a geopoint vector from the structure array.
structArray = shaperead("tsunamis.shp",UseGeoCoords=true);
p = geopoint(structArray);
Sort the dynamic properties so they are in alphabetical order.
fn = fieldnames(p);
p = p(:,sort(fn));
Create a new geopoint vector that contains these dynamic properties: 'Year', 'Month', 'Day', 'Hour', and 'Minute'.
dp = {'Year','Month','Day','Hour','Minute'};
p2 = p(:,dp);To set property values, use the () operator, or assign
array values to corresponding fields, or use dot '.'
notation (object.property) to assign new property
values.
pts = geopoint();
pts.Latitude = [42 44 45];
pts.Longitude = [-72 -72.1 -71];
pts
pts =

 3x1 geopoint vector with properties:

 Collection properties:
     Geometry: 'point'
     Metadata: [1x1 struct]
 Feature properties:
     Latitude: [42 44 45]
    Longitude: [-72 -72.1000 -71]
Use ( ) to assign values to fields.
pts(3).Latitude = 45.5;
pts
pts =

 3x1 geopoint vector with properties:

 Collection properties:
     Geometry: 'point'
     Metadata: [1x1 struct]
 Feature properties:
     Latitude: [42 44 45.5000]
    Longitude: [-72 -72.1000 -71]
Use dot notation to create new dynamic properties
pts.Name = {'point1', 'point2', 'point3'}
pts =

 3x1 geopoint vector with properties:

 Collection properties:
     Geometry: 'point'
     Metadata: [1x1 struct]
 Feature properties:
     Latitude: [42 44 45.5000]
    Longitude: [-72 -72.1000 -71]
         Name: {'point1' 'point2' 'point3'}
Get property values
pts.Name
ans =

    'point1'    'point2'    'point3'
Remove dynamic properties. To delete or remove dynamic properties, set
them to [] or set the Latitude or
Longitude property to [].
pts.Temperature = 1:3
pts =

 3x1 geopoint vector with properties:

 Collection properties:
       Geometry: 'point'
       Metadata: [1x1 struct]
 Feature properties:
       Latitude: [42 44 45.5000]
      Longitude: [-72 -72.1000 -71]
           Name: {'point1' 'point2' 'point3'}
    Temperature: [1 2 3]
By setting the Temperature property to
[], this dynamic property is deleted.
pts.Temperature = []
pts =

 3x1 geopoint vector with properties:

 Collection properties:
     Geometry: 'point'
     Metadata: [1x1 struct]
 Feature properties:
     Latitude: [42 44 45.5000]
    Longitude: [-72 -72.1000 -71]
         Name: {'point1' 'point2' 'point3'}
To clear all fields in the geopoint vector, set the
Latitude or Longitude property to
[].
pts.Latitude = []
pts =

 0x1 geopoint vector with properties:

 Collection properties:
     Geometry: 'point'
     Metadata: [1x1 struct]
 Feature properties:
     Latitude: []
Longitude: []If you typically store latitude and longitude coordinates in an N-by-2 or 2-by- M array, you can assign these numeric values to a geopoint vector. If the coordinates are N-by-2, the first column is assigned to the Latitude property and the second column to the Longitude property. If the coordinates are 2-by- M , then the first row is assigned to the Latitude property and the second row to the Longitude property.
load coastlines;
ltln = [coastlat coastlon];		% 9865x2 array
pts = geopoint;		        	% null constructor
pts(1:numel(coastlat)) = ltln;	% assign array
pts.Metadata.Name = 'coastline';
pts
pts =
 9865×1 geopoint vector with properties:

 Collection properties:
     Geometry: 'point'
     Metadata: [1×1 struct]
 Feature properties:
     Latitude: [-83.8300 -84.3300 -84.5000 -84.6700 -84.9200 -85.4200 -85.4200 -85.5800 -85.3300 -84.8300 -84.5000 -84 -83.5000 -83.0000 -82.5000 -82 -81.5000 -81.1700 -81 -80.9200 -80.6700 -80.3300 -80 -79.6700 -79.2500 -78.8300 … ] (1×9865 double)
    Longitude: [-180 -178 -174 -170 -166.0000 -163 -158 -152 -146 -147 -151 -153.5000 -153 -154.0000 -154.0000 -154.0000 -154.5000 -153 -150.0000 -146.5000 -145.5000 -148 -150.0000 -152.5000 -155 -157.0000 -157.2554 -157.5072 -157.7554 … ] (1×9865 double)
pts.Metadata
ans = struct with fields:
    Name: 'coastline'
More About
Tips
If
Latitude,Longitude, or a dynamic property is set with more values than features in the geopoint vector, then all other properties expand in size using 0 for numeric values and an empty character vector ('') for cell values. See Manipulate a Geopoint Vector for examples of these behaviors.If a dynamic property is set with fewer values than the number of features, then this dynamic property expands to match the size of the other properties by inserting a 0, if the value is numeric, or an empty character vector (
''), if the value is a cell array.If the
LatitudeorLongitudeproperty of the geopoint vector is set with fewer values than contained in the object, then all other properties shrink in size.If either
LatitudeorLongitudeare set to [ ], then both coordinate properties are set to [ ] and all dynamic properties are removed.If a dynamic property is set to [ ], then it is removed from the object.
Version History
Introduced in R2012a