Overlay Multiple WMS Layers
Create Composite Map of Multiple Layers from One Server
The WMS specification enables a server to merge multiple layers into a single raster map. The EOX::Maps server contains several data layers, such as coastlines, hydrography, imagery, and terrain. Read and display a composite of multiple layers from the EOX::Maps server. For more information about EOX::Maps, see EOX::Maps.
Read the capabilities document from the EOX::Maps server. Extract the list of layers from the capabilities document.
info = wmsinfo("https://tiles.maps.eox.at/wms?");
eox = info.Layer;
Create an array of multiple layers that includes terrain, coastlines, and hydrography.
terrain = refine(eox,"terrain-light",MatchType="exact");
coast = refine(eox,"coastline",MatchType="exact");
hydro = refine(eox,"hydrography",MatchType="exact");

layers = [hydro; coast; terrain];
Read the composite map from the server. Get a map that uses a cell size of 0.5 degrees by specifying the height and width of the image. Use a transparent value for pixels that do not represent data values.
[A,R] = wmsread(layers,Transparent=true,ImageHeight=360,ImageWidth=720);
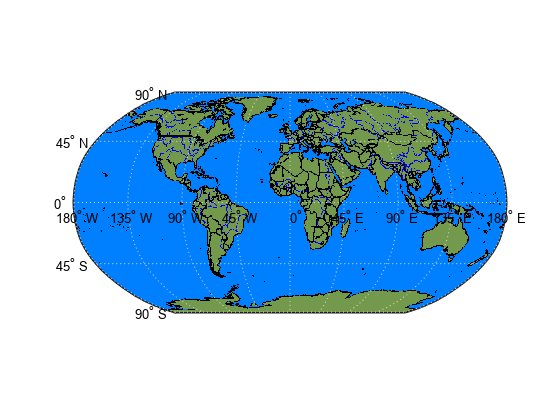
Display the composite map.
figure
worldmap world
geoshow(A,R)
title("Composite of EOX::Map Layers")

Combine Layers from One Server with Data from Other Sources
This example shows how to merge raster data from a WMS server with vector data from shapefiles.
Create a geographic raster reference object by using the georefcells function. Specify latitude and longitude limits that cover the globe. Specify the cell extent for the raster as 0.5 degrees. For consistency with the wmsread function, specify columns that run from north to south.
latlim = [-90 90];
lonlim = [-180 180];
cellExtent = 0.5;
R = georefcells(latlim,lonlim,cellExtent,cellExtent,ColumnsStartFrom="north");
Read world land areas from a shapefile into the workspace. The shapefile represents the land areas using polygons. Convert the polygons into a raster map. Specify the size of the raster map using the size data embedded in the reference object.
land = shaperead("landareas.shp",UseGeoCoords=true);
latAreas = [land.Lat];
lonAreas = [land.Lon];
land = vec2mtx(latAreas,lonAreas,zeros(R.RasterSize),R,"filled");
Read world rivers from a shapefile into the workspace. The shapefile represents the rivers using polylines. Convert the polylines into a raster map.
rivers = shaperead("worldrivers.shp",UseGeoCoords=true);
latRivers = [rivers.Lat];
lonRivers = [rivers.Lon];
rivers = vec2mtx(latRivers,lonRivers,land,R);
Create a new raster map by merging the land data with the rivers data.
A = land;
A(rivers == 1) = 3;
The land data and rivers data use the same coordinate reference system (CRS). Get the CRS by using the shapeinfo function. Then, set the CRS of the reference object to match the CRS of the land and rivers data.
info = shapeinfo("landareas.shp");
R.GeographicCRS = info.CoordinateReferenceSystem;
Get a layer containing boundaries data from the EOC Basemap Map Service server.
info = wmsinfo("https://geoservice.dlr.de/eoc/basemap/wms?");
eoc = info.Layer;
layer = refine(eoc,"ne_countries");
Read the data from the server. Specify the size of the image using the size data embedded in the reference object.
height = R.RasterSize(1);
width  = R.RasterSize(2);
[B,BR] = wmsread(layer,ImageFormat="image/png",ImageHeight=height,ImageWidth=width);
Confirm that the reference object for the boundaries data is the same as the reference object for the merged land and rivers data.
isequal(BR,R)
ans = logical
   1
Merge the boundaries data with the land and rivers data.
index = B(:,:,1) ~= 255 & B(:,:,2) ~= 255 & B(:,:,3) ~= 255;
A(index) = 1;
Display the result on a map.
figure
worldmap(A,R)
geoshow(A,R,DisplayType="texturemap")
Apply a colormap that uses green for the land areas, black for the boundaries, blue for the rivers, and light blue for the ocean.
landColor = [0.45 0.60 0.30];
boundaryColor = [0 0 0];
riverColor = [0 0.5 1];
oceanColor = [0 0 1];
colormap([landColor; boundaryColor; riverColor; oceanColor])
Drape Orthoimagery Over DEM
Read elevation data and a geographic postings reference for an area around South Boulder Peak in Colorado. Crop the elevation data to a smaller area using the geocrop function.
[fullZ,fullR] = readgeoraster("n39_w106_3arc_v2.dt1",OutputType="double");

latlim = [39.25 40.0];
lonlim = [-106 -105.5];
[Z,R] = geocrop(fullZ,fullR,latlim,lonlim);
Display the elevation data. To do this, create an axesm-based map for the United States, plot the data as a surface, and apply an appropriate colormap. View the map in 3-D by adjusting the camera position and target. Set the vertical exaggeration by using the daspectm function.
figure
usamap(R.LatitudeLimits,R.LongitudeLimits)
geoshow(Z,R,DisplayType="surface")
demcmap(Z)
title("Elevation");

cameraPosition = [218100 4367600 183700];
cameraTarget = [0 4754200 2500];
set(gca,"CameraPosition",cameraPosition, ...
        "CameraTarget",cameraTarget)
daspectm("m",3)

Drape an orthoimage over the elevation data. To do this, first get the names of high-resolution orthoimagery layers from the USGS National Map using the wmsinfo function. In this case, the orthoimagery layer is the only layer from the server. Use multiple attempts to connect to the server in case it is busy.
numberOfAttempts = 5;
attempt = 0;
info = [];
serverURL = ...
   "http://basemap.nationalmap.gov/ArcGIS/services/USGSImageryOnly/MapServer/WMSServer?";
while(isempty(info))
    try
        info = wmsinfo(serverURL);
        orthoLayer = info.Layer(1);
    catch e
        attempt = attempt + 1;
        if attempt > numberOfAttempts
            throw(e);
        else
            fprintf('Attempting to connect to server:\n"%s"\n',serverURL)
        end
    end
end
Request a map of the orthoimagery layer using the wmsread function. To display the orthoimagery, use the geoshow function and set the CData property to the layer.
imageHeight = size(Z,1);
imageWidth  = size(Z,2);

orthoImage = wmsread(orthoLayer,Latlim=R.LatitudeLimits, ...
    Lonlim=R.LongitudeLimits,ImageHeight=imageHeight, ...
    ImageWidth=imageWidth);

figure
usamap(R.LatitudeLimits,R.LongitudeLimits)
geoshow(Z,R,DisplayType="surface",CData=orthoImage);
title("Orthoimage Draped Over Elevation");
set(gca,"CameraPosition",cameraPosition, ...
        "CameraTarget",cameraTarget)
daspectm('m',3)

The DTED file used in this example is from the US Geological Survey.