Geographic Data Structures
Vector data uses points, lines, polygons, and their nonspatial attributes to describe events, locations, and objects. One way to represent vector data is by using geographic data structures. A geographic data structure is a structure array that contains one element per geographic feature.
There are two types of geographic data structures. A mapstruct
array stores map coordinates (x and y) using
X and Y fields, and a
geostruct array stores geographic coordinates (latitude and
longitude) using Lon and Lat fields.
Note
Starting in R2021b, you can also represent vector data by using geospatial tables.
Geospatial tables are table or
timetable objects with a Shape variable and
attribute variables. Geospatial tables enable you to:
Filter, rearrange, and access data using standard MATLAB® table functions.
Examine and modify the shapes by using functions such as
isinterior,mapclip, andgeoclip.Plot data on geographic axes or map axes by specifying tables as input to the
geoplotfunction.
For more information about geospatial tables, see Create Geospatial Tables.
There are several ways to create geographic data structures:
Fields of Geographic Data Structures
Geographic data structures contain these fields:
| Field | Description |
|---|---|
Geometry | Type of shape, specified as a character vector such as
Individual points, lines, and polygons can have multiple parts. For example, lines can contain disconnected line segments, and polygons can have rings. All parts of an individual shape share the attributes specified for that shape by the corresponding attribute fields. Geographic data structures do not support assigning distinct attributes to the different parts of an individual shape. |
BoundingBox | Minimum and maximum coordinate values for the shape,
specified as a 2-by-2 numeric matrix of the form
|
X | x-coordinates, specified as a row
vector of data type |
Y |
y-coordinates, specified as a row vector
of data type |
Lon | Longitude coordinates, specified as a row vector of
data type |
Lat | Latitude coordinates, specified as a row vector of
data type |
| Attribute fields | Attribute fields, specified as character vectors or numeric scalars. |
Read Geographic Data Structures from Shapefiles
This example shows how to read data from a shapefile into a geographic data structure by using the shaperead function. The shaperead function is the most common way to create geographic data structures.
Starting in R2021b, you can read the same data into a geospatial table by using the readgeotable function. The readgeotable function supports several vector data formats in addition to shapefiles, including KML and GeoJSON files.
Read a shapefile containing road data into the workspace. The function returns a geographic data structure (in this case a mapstruct array) that contains 609 elements. In addition to the Geometry, BoundingBox, and coordinate fields (X and Y), the mapstruct array has five attribute fields: STREETNAME, RT_NUMBER, CLASS, ADMIN_TYPE, and LENGTH.
S = shaperead("concord_roads.shp")S=609×1 struct array with fields:
Geometry
BoundingBox
X
Y
STREETNAME
RT_NUMBER
CLASS
ADMIN_TYPE
LENGTH
Display the road data on a map.
mapshow(S)

By default, the shaperead function assumes that the shapefile contains map coordinates and reads the data into a mapstruct array. When your shapefile contains geographic coordinates, you can read the data into a geostruct array by specifying the UseGeoCoords name-value argument as true. If you do not know whether a shapefile contains map coordinates or geographic coordinates, you can try these strategies.
If the shapefile includes a projection file (
.prj), you can get information about the coordinate reference system by using theshapeinfofunction. If theCoordinateReferenceSystemfield of the returned structure is aprojcrsobject, then the shapefile contains map coordinates. If the field is ageocrsobject, then the shapefile contains geographic coordinates.If the shapefile does not include a projection file, you can get the bounding box of the coordinates by using the
shapeinfofunction. You might be able to determine the type of coordinates by looking at the ranges of the coordinates.
If you cannot determine whether your shapefile contains map coordinates or geographic coordinates using these strategies, consider asking your data provider.
Create Geographic Data Structures
Create geographic data structures from variables in the workspace. The variables can represent data imported from files or data computed using MATLAB® functions.
Starting in R2021b, you can also create geospatial tables from variables in the workspace. For more information about creating geospatial tables, see Create Geospatial Tables.
Create Geostruct Array of Points
Create a geostruct array of points. For this example, use the geostruct array to store the locations and names of cities.
Specify the latitude and longitude coordinates of Paris, Santiago, and New York City.
latP = 48.87084;
lonP = 2.41306;
latS = -33.36907;
lonS = -70.82851;
latN =  40.69746;
lonN = -73.93008;
Create an empty structure array. Add a Geometry field that defines the structure array elements as points. Add Lat and Lon fields that store the coordinates of the points.
Cities = struct;

[Cities(1:3).Geometry] = deal('Point');

Cities(1).Lat = latP;
Cities(1).Lon = lonP;

Cities(2).Lat = latS;
Cities(2).Lon = lonS;

Cities(3).Lat = latN;
Cities(3).Lon = lonN;
Add a Name attribute field that stores the names of the cities.
Cities(1).Name = "Paris";
Cities(2).Name = "Santiago";
Cities(3).Name = "New York";
View the geostruct array.
Cities
Cities=1×3 struct array with fields:
    Geometry
    Lat
    Lon
    Name
Create Geostruct Array of Lines
Create a geostruct array of lines. For this example, use the geostruct array to store great circle tracks between the cities.
Create an empty structure array. Add a Geometry field that defines the structure array elements as lines.
Tracks = struct;

[Tracks(1:3).Geometry] = deal('Line');
Add a Type attribute field that identifies the tracks as great circle tracks. Many functions use the input "gc" to identify tracks as great circle tracks.
trackType = "gc";
[Tracks.Type] = deal(trackType);
Calculate the coordinates of the great circle tracks between the cities. Then, add the coordinates to the structure array as Lat and Lon fields.
[latPS,lonPS] = track2(trackType,latP,lonP,latS,lonS);
[latSN,lonSN] = track2(trackType,latS,lonS,latN,lonN);
[latNP,lonNP] = track2(trackType,latN,lonN,latP,lonP);

Tracks(1).Lat = latPS;
Tracks(1).Lon = lonPS;

Tracks(2).Lat = latSN;
Tracks(2).Lon = lonSN;

Tracks(3).Lat = latNP;
Tracks(3).Lon = lonNP;
Label the track names by adding a Name attribute field to the structure array.
Tracks(1).Name = "Paris-Santiago";
Tracks(2).Name = "Santiago-New York";
Tracks(3).Name = "New York-Paris";
Calculate the lengths and azimuths of the great circle tracks. Then, add the results to the structure array as Length and Azimuth attribute fields.
[distPS,azPS] = distance(trackType,latP,lonP,latS,lonS);
[distSN,azSN] = distance(trackType,latS,lonS,latN,lonN);
[distNP,azNP] = distance(trackType,latN,lonN,latP,lonP);

Tracks(1).Length = distPS;
Tracks(1).Azimuth = azPS;

Tracks(2).Length = distSN;
Tracks(2).Azimuth = azSN;

Tracks(3).Length = distNP;
Tracks(3).Azimuth = azNP;
View the geostruct array.
Tracks
Tracks=1×3 struct array with fields:
    Geometry
    Type
    Lat
    Lon
    Name
    Length
    Azimuth
Display Data Contained in Geostruct Arrays
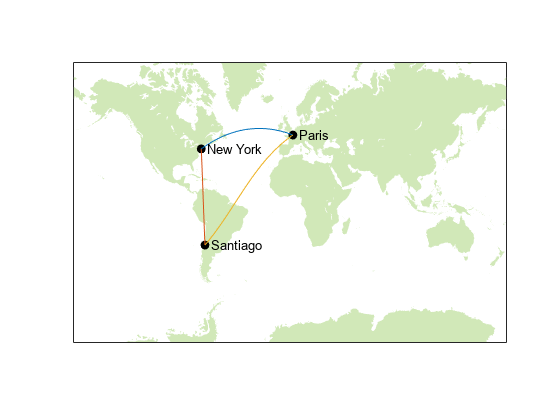
Display the city locations and names on the map.
figure
axesm("mercator","MapLatLimit",[-75 75])
tightmap
geoshow("landareas.shp","FaceColor",[0.82 0.91 0.72],"EdgeColor","none")

geoshow(Cities,"Marker","o","MarkerFaceColor","k","MarkerEdgeColor","k")
textm([Cities.Lat],[Cities(:).Lon]+5,[Cities(:).Name])
Display the great circle tracks on the map. Specify the appearance of the lines by using a symbol specification.
colorRange = makesymbolspec("Line", ...
    {'Length',[min([Tracks.Length]) max([Tracks.Length])],"Color",lines(3)});
geoshow(Tracks,"SymbolSpec",colorRange)
Create Geostruct Array of Polygons
The process for creating a geostruct or mapstruct array of polygons is similar to the process for creating geostruct arrays of points and lines. For information about specifying the coordinates of polygon vertices, see Create and Display Polygons.
For an example of working with geostruct arrays of polygons, see Convert Coastline Data (GSHHG) to Shapefile Format.