showlabels
Description
showlabels(
uses name-value arguments to modify the appearance of the overlay.b,labels,Name=Value)
Example: showlabels(b,labels,Colormap="jet") displays the label
overlay using the "jet" colormap.
Examples
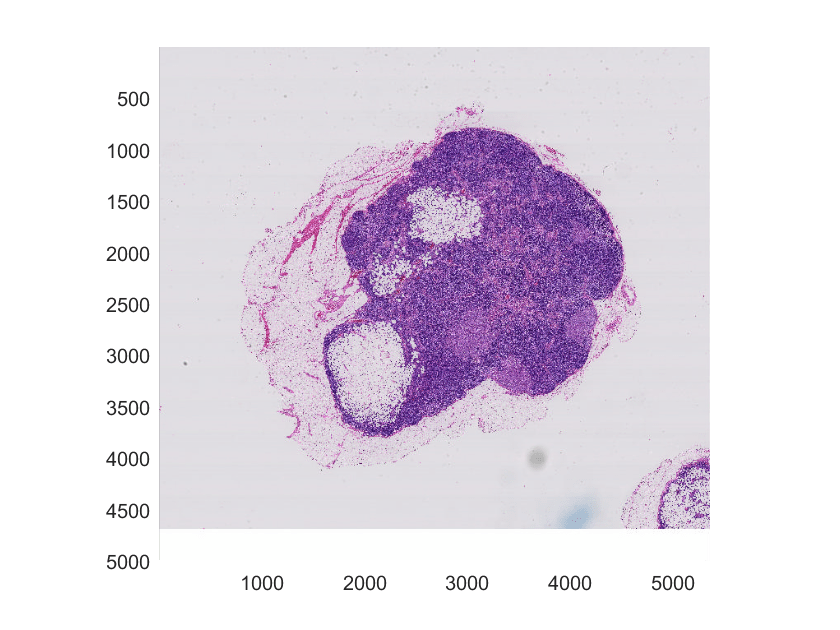
Create a blocked image from the sample image tumor_091R.tif. This sample image is a training image of a lymph node containing tumor tissue from the CAMELYON16 data set. The image has been modified to have three coarse resolution levels, and has been adjusted to enforce a consistent aspect ratio and to register features at each level.
bim = blockedImage("tumor_091R.tif");Create a label image at a coarse resolution level.
First get a single-resolution image. By default, gather gets data from the coarsest resolution level.
cim = gather(bim);
Convert the image to grayscale. Use multithresh to calculate three threshold values to convert the image into a four-level image.
cgim = im2gray(cim);
numClasses = 4;
thresh = multithresh(cgim,numClasses-1);
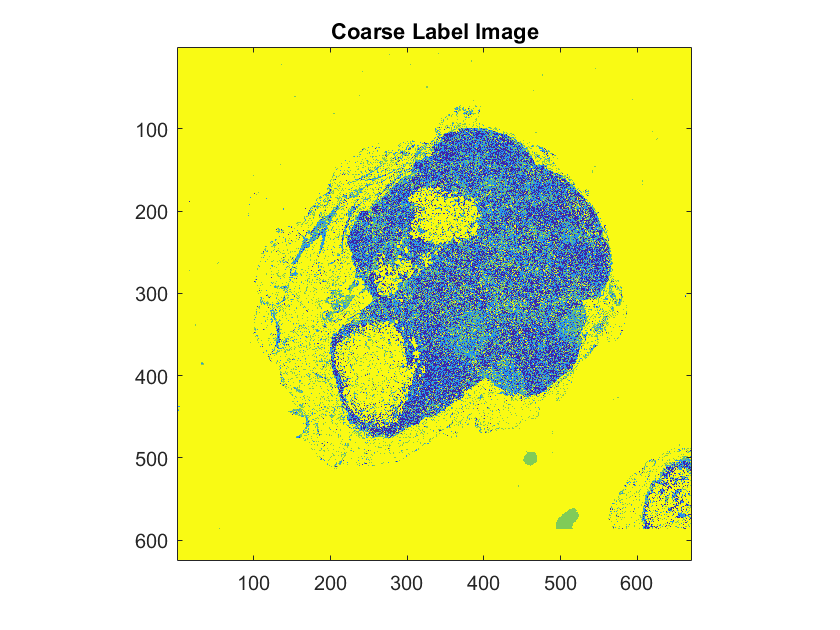
Segment the image into four regions using imquantize, specifying the threshold levels returned by multithresh.
labels = imquantize(cgim,thresh);
imagesc(labels)
axis square
title("Coarse Label Image")
Convert the labels image back to a blockedImage object, using the same spatial referencing as the original image at the coarsest resolution level.
blabels = blockedImage(labels,WorldStart=bim.WorldStart(3,1:2),...
    WorldEnd=bim.WorldEnd(3,1:2));
Display the original blocked image.
figure
hB = bigimageshow(bim);
Overlay the labels image on the original blocked image.
showlabels(hB,blabels)
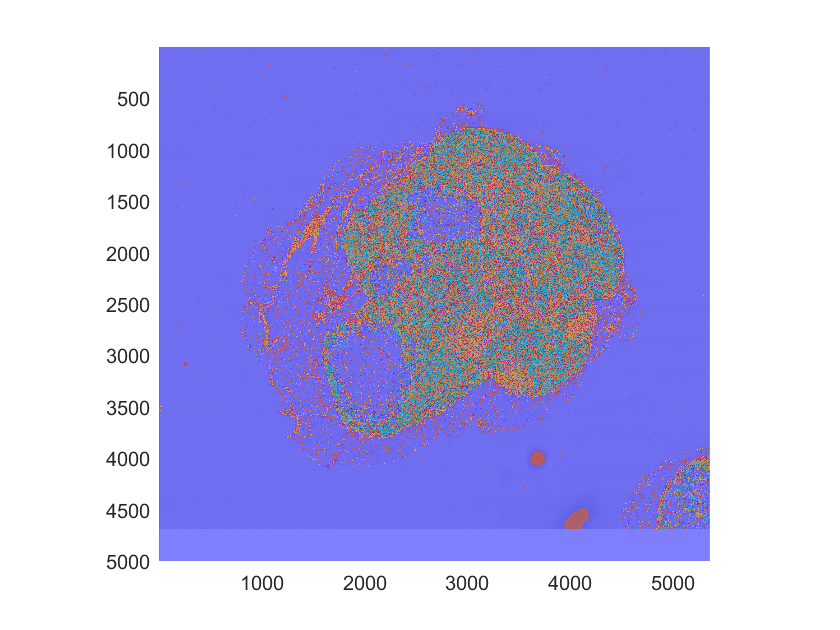
Create a blocked image using a modified version of image tumor_091R.tif from the CAMELYON16 data set. The original image is a training image of a lymph node containing tumor tissue. The original image has eight resolution levels, and the finest level has resolution 53760-by-61440. The modified image has only three coarse resolution levels. The spatial referencing of the modified image has been adjusted to enforce a consistent aspect ratio and to register features at each level.
bim = blockedImage("tumor_091R.tif");Create a mask at the coarsest resolution level and display it.
blabels = apply(bim,@(bs)rgb2lightness(bs.Data)<80,Level=3);
hbim = bigimageshow(blabels);
![]()
Display the original blocked image with the mask as a label overlay. Use the Alphadata and Alphamap name-value arguments to display the mask background overlay as translucent and the mask foreground overlay as fully transparent.
hbim = bigimageshow(bim);
showlabels(hbim,blabels,AlphaData=blabels,Alphamap=[0.8 0])
![]()
Load a file containing an image, img, and its corresponding pixel label data, label. Convert the image to a blockedImage object.
load("buildingPixelLabeled.mat")
bim = blockedImage(img);
Create a blocked image of the categorical pixel label data. Display the order of the four label categories.
blabel = blockedImage(label);
labels = categories(blabel.InitialValue)
labels = 4×1 cell
    {'sky'     }
    {'grass'   }
    {'building'}
    {'sidewalk'}
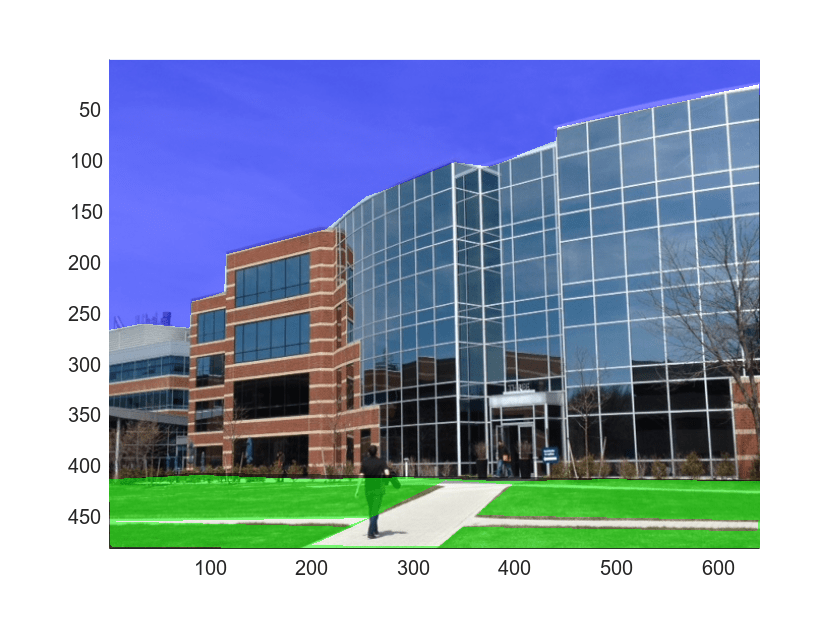
Define a custom colormap specifying RGB triplets for each category. The first row of cmap corresponds to undefined pixel labels, and the remaining four rows correspond to each categorical label. Assign the sky overlay to display blue and the grass overlay to display green.
cmap = [0 0 0; 0 0 1; 0 1 0; 0 0 0; 0 0 0];
Define the transparency map.
amap = [.5 .5 0 0];
Display the original unlabeled blocked image and the label overlay on the same axes. The AlphaData and Alphamap name-value arguments map each defined category in blabel to the corresponding element in amap, making the sky and grass overlays translucent and the building and sidewalk overlays fully transparent. Undefined pixel labels map to the first element in amap.
hbim = bigimageshow(bim);
showlabels(hbim,blabel,AlphaData=blabel,Alphamap=amap,Colormap=cmap)
Input Arguments
Name-Value Arguments
Version History
Introduced in R2021b