Identify Vegetation and Non-Vegetation Spectra
This example shows you how to:
Use 2-D spectral data as a hypercube for the hyperspectral functions.
Separate vegetation and non-vegetation spectra by using
ndvifunction.
This example requires the Hyperspectral Imaging Library for Image Processing Toolbox™. You can install the Hyperspectral Imaging Library for Image Processing Toolbox from Add-On Explorer. For more information about installing add-ons, see Get and Manage Add-Ons. The Hyperspectral Imaging Library for Image Processing Toolbox requires desktop MATLAB®, as MATLAB® Online™ and MATLAB® Mobile™ do not support the library.
Load 2-D Spectral Data
Load 2-D spectral data containing 20 endmembers of the Indian Pines data set into the workspace.
load("indian_pines_endmembers_20.mat")Load the wavelength values for each band of the Indian Pines data set into the workspace.
load("indian_pines_wavelength.mat")Prepare Test Data to Use for Hyperspectral Functions
Reshape the 2-D spectral data into a 3-D volume data using the reshape function.
[numSpectra,spectralDim] = size(endmembers);
dataCube = reshape(endmembers,[numSpectra 1 spectralDim]);
Create a 3-D hypercube object, with a singleton dimension, by specifying the 3-D volume data dataCube and wavelength information wavelength to the hypercube function.
hcube = imhypercube(dataCube,wavelength);
Compute NDVI to Separate Vegetation and Non-Vegetation Spectra
Compute the NDVI value for each spectrum in the hypercube object.
ndviVal = ndvi(hcube);
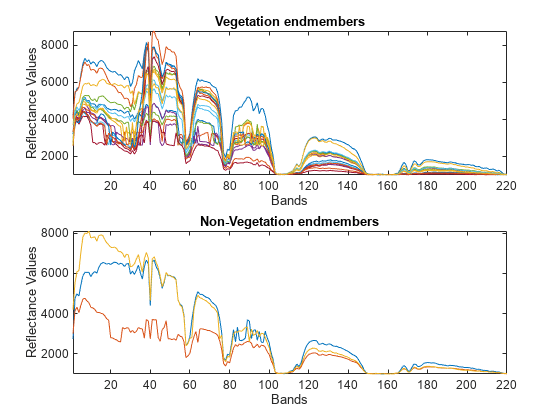
Vegetation spectra typically have NDVI values greater than zero and non-vegetation spectra typically have NDVI values less than zero. Perform thresholding to separate the vegetation and non-vegetation spectra.
index = ndviVal > 0;
Plot the vegetation and non-vegetation endmembers.
subplot(2,1,1)
plot(endmembers(index,:)')
title("Vegetation endmembers")
xlabel("Bands")
ylabel("Reflectance Values")
axis tight
subplot(2,1,2)
plot(endmembers(~index,:)')
title("Non-Vegetation endmembers")
xlabel("Bands")
ylabel("Reflectance Values")
axis tight
See Also
hypercube | spectralMatch | ndvi